New Study Lists 1.2BSF of U.S. Office Space as Quality Residential Conversions
With remote and hybrid work upending office utilization rates across the country, office property owners are looking at ways to ensure the future profitability of their properties. While that often means adjusting to the flight to quality and upgrading existing properties, interest in converting vacant office buildings into residential units has grown among owners as well as policymakers.
In this developing context, commercial real estate listing and research platform CommercialEdge has developed a new tool dubbed the Conversion Feasibility Index (CFI), which awards office properties a weighted score based on their feasibility for conversion into residential. The score is based on factors such as building age, location, total square footage, floor plate shape, ceiling height, transit accessibility and more.
Using this new tool, CommercialEdge found that 228.3 million square feet of office space — or 2.7% of existing office stock in the U.S. — is ranked as Tier I, representing prime office-to-residential conversion candidates. Additionally, another 1 billion square feet of office space — or 12.1% of stock — is classed as Tier II, meaning it offers strong conversion potential with some modifications or adjustments. The remainder is made up of Tier III properties, which face significant challenges when it comes to conversions to residential space.
“With the continued destruction of office values and as we see an uptick in incentives at different levels of government, we believe the total pool for potential conversions into multifamily is larger than initially expected,” said Peter Kolaczynski, director of CommercialEdge. “Not a cure-all by any means, but the 1.25 billion square feet identified isn’t insignificant.”
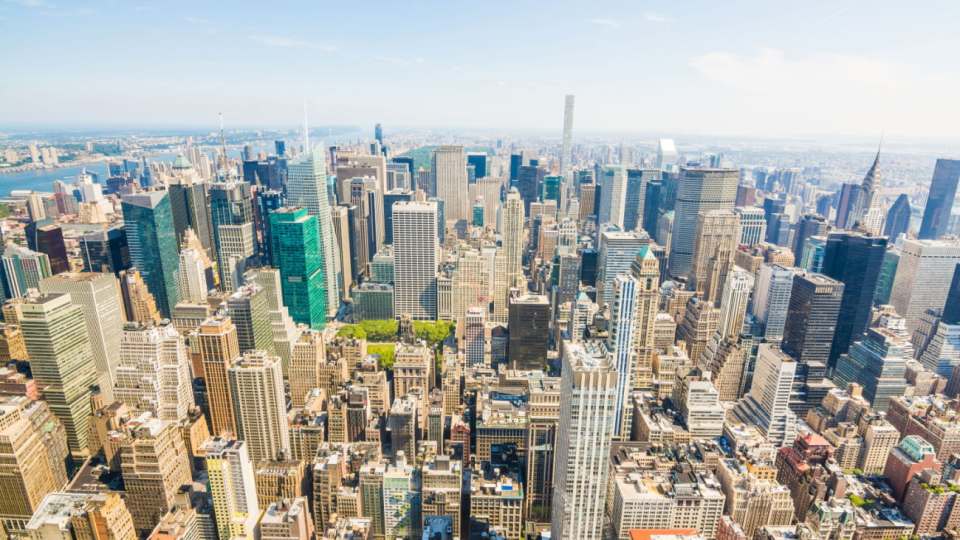
At a market level, the locations with the largest concentrations of strong conversion candidates include Manhattan (16.8% Tier I and 36.3% Tier II), San Francisco (6.2% and 19.6%), Los Angeles (4.4% and 20.3%), Chicago (4.1% and 14.5%) and Miami (3.7% and 12.4%). These markets have significant office inventories with positive factors for residential conversions. At the same time, housing prices have become more of a challenge in several of these locations, so office-to-multifamily conversions could provide a welcome boost to residential unit inventories.
Still, CommercialEdge points out that conversions are still niche, although local governments are doing their best to push such initiatives along.
National Office Asking Rates Rest at $31.67 as $17.1B Trades Hands in Office Sales YTD
The average full-service equivalent listing rate at a national level stood at $31.67 in July, unchanged from the previous month. The office report underscores that Manhattan, San Francisco and the Bay Area were the markets with the highest listing rates at $71.34, $61.38 and $53.71, respectively.
San Francisco was one of the markets with the largest 12-month drops in asking rates at -4.2%, alongside the Twin Cities (-8.4%), San Diego (-8%) and Los Angeles (-4.6%). At the opposite end of the spectrum, markets experiencing the largest rent growth year-over-year included Miami (5.9%), Dallas (5.2%) and Atlanta (3.9%).
If you’re looking to lease office space, check out what some of the nation’s most diverse inventories have to offer. Alternatively, start a personalized search from our homepage and choose among office spaces based on location, prices, amenities, square footage and other specialized search terms.
Looking at sales, office transactions so far this year total $17.1 billion for an average of $173 per square foot. A large share of this figure is made up by discounted sales: 28% of all office buildings sold this year traded for a lower price than their previously recorded sale, which is up from 18% of buildings sold last year. Manhattan recorded the largest sales volume year-to-date at $2.03 billion, followed by Washington, D.C. with $1.57 billion and the Bay Area’s $1.01 billion.
For more details, check out CommercialEdge’s national office report.

