
The often-touted “remote work revolution” has had an undeniable effect on how Americans work and live. As such, millions more workers telecommute now than in 2019, and the potential for flexible work arrangements brought an alternative to the long-lasting commuting status quo.
However, moving past the theoretical advantages, the benefits of remote work adoption are far from evenly spread. According to WFH Research’s Survey of Working Arrangements and Attitudes, just 12.7% of full-time employees in the U.S. are fully remote in 2024, while 28.2% work hybrid and a majority of 59.1% still work in-office. In practical terms, this means that many American workers can avoid commuting by logging on remotely only some days a week, and that workers in the same household often have to accommodate competing work models.
Much has been said about the most remote work-friendly cities in the U.S., but what about the ones combining remote work capabilities with the right infrastructure for in-office work and commuting? To find out, we compiled a list of all U.S. cities with more than 100,000 residents and complete data across all of our metrics, giving them two separate scores. We then added up the two scores, resulting in a national ranking of cities bringing the best of both worlds:
Best Cities for Mixing WFH & WFO: Florida Leads With 2 Best Entries, South Provides 7 of Top 10 Spots
The nation’s cities with the best infrastructure for pairing remote work and on-site work were mostly located in the Sun Belt. The Southern U.S. claimed seven of the 10 entries with the highest total scores (the sum of their respective WFH and WFO scores), with Florida alone being home to both the best-ranking city — Fort Lauderdale — as well as runner-up Miami and #10 Orlando. Four more Southern entries landed between the 11th and 20th spots.
Meanwhile, the Midwest and West were represented on the top 20 list by four entries each, while the Northeast’s highest-rated entry was Cambridge, Mass., at #23.
WFH
Remote work-friendly businesses: A plethora of companies in remote-friendly sectors — like tech, telecom and aerospace — are either headquartered in Fort Lauderdale or operate offices in the city. From local stories like Citrix Systems and Accelirate to household names like AT&T, plenty of companies boost Fort Lauderdale’s remote work offering. Note: Because the U.S. Census Bureau’s Business Dynamics Statistics is only available at a metro level, Fort Lauderdale and Miami received the same score in this metric.
Coworking availability: Fort Lauderdale hosts 14.2 coworking spaces per 100,000 residents for the fifth-highest density on the entire 210-city list, thereby providing plenty of options for remote workers looking for a change of setting. That includes national brands like Regus and Spaces, in addition to local hubs, like General Provision and Axis Space.
Rent affordability: According to the latest data from the U.S. Census Bureau, the median gross rent in Fort Lauderdale is 26.5% of the average household’s income — a figure in the higher echelons for cities with a similar population.
WFO
City amenities & establishments: Amenities and establishments like fitness centers, eateries, and entertainment venues — as well as services like daycares and healthcare providers — can encourage hybrid workers to take more in-office days and contribute to the wellbeing of fully on-site workers. Fort Lauderdale has the highest density of such amenities per capita among all 210 cities in the study.
Commute time: Commuting to or from work in the city takes 27.7 minutes, on average, resulting in the third-most time spent in traffic for office workers among the cities in the top 20.
WFH
Free Wi-Fi: Miami has the highest density of free Wi-Fi hotspots per capita in the top 20, outpacing entries such as Salt Lake City and Orlando, Fla. The city is also second among all 210 cities in the study in that regard, narrowly losing the top spot to Richmond, Va., which ranked #151 in the overall list.
Remote work-friendly businesses: Miami is home to regional and national headquarters belonging to numerous major companies, and a large number of them operate in industries more likely to offer remote jobs. Note: Because the U.S. Census Bureau’s Business Dynamics Statistics is only available at a metro level, Fort Lauderdale and Miami received the same score in this metric.
Rent affordability: High demand from digital workers, as well as retirees and other groups, means that Miami scored lower in rent affordability. What's more, rent in Miami is even less affordable than it is in Fort Lauderdale, taking up a median of 31.1% of household income. This means that the city’s strong remote work infrastructure comes at a cost.
WFO
City amenities & establishments: On the entire list encompassing 210 cities, Miami has the second-highest density of amenities and venues that can attract office workers — second only to neighboring Fort Lauderdale.
Share of onsite workers: According to U.S. Census Bureau data, 82.5% of employed Miamians are onsite workers, marking the fourth-highest share in the top 20. While remote work is here to stay in Miami, the city is leading in return-to-office trends, mostly due to tech companies looking for quality face-to-face employee collaboration.
Commute time: A one-way commute in Miami takes 29 minutes, on average, which is more than Houston’s 27.3 minutes or Phoenix’s 24.9 minutes. More time spent in traffic is an unfortunate side effect of Miami’s large population of in-office workers.
WFH
Coworking availability: Atlanta has great infrastructure and conditions for remote work, but focus can sometimes be hard to find at home. Fortunately for telecommuters facing that issue, the city has a handy solution in the form of flexible offices as it boasts the highest number of coworking spaces per capita on the entire list of 210 locations. With a great concentration of spaces in neighborhoods like Buckhead and the Old Fourth Ward, remote workers can experience the best the city has to offer.
Average apartment size: The average apartment in multifamily units in Atlanta stands at just under 950 square feet — marking the fifth-best showing in this metric in the top 20. This means that apartments here are more spacious, on average, than they are in other locations, making a home office more viable.
Rent affordability: While not as expensive as the previous two podium entries from Florida, Atlanta's median rents are still on the expensive side in relation to median salaries in the city.
WFO
Quality office space (Class A/A+): More than three quarters of office space in Atlanta is rated either Class A or A+. Higher-quality office space is closely tied to employee willingness to come into work and their perceived satisfaction while doing so. As such, workers here are much more likely to enjoy the benefits of a top-tier office space in one of Atlanta's prime locations for office space like downtown, Midtown or Buckhead.
City amenities & establishments: Atlantans can also make the most of their time after work as the city is home to the fourth-highest share of venues — like amusement parks, restaurants, museums and more — among the top 20. From mainstays like the Botanical Garden and the World of Coca-Cola to countless mom-and-pop restaurants, there's something for everyone here.
Unemployment rate: The unemployment rate in Atlanta stood at 4.8%, according to the Census Bureau’s one-year estimates, which is the weakest showing in the top 20 in that regard — a fact that can equally affect those looking for remote or on-site jobs.
WFH
High-speed internet coverage: More than 95% of Arlington has high-speed internet coverage for the third-best coverage in the top 20. The city also had strong showings in several other work-from-home metrics, as well, providing it with the #1 highest WFH score out of all 210 cities in the study.
Remote work-friendly businesses: Arlington is home to government agencies, as well as the national headquarters of Boeing, Raytheon and Amazon. This, remote work options in Arlington abound. Note: Because the U.S. Census Bureau’s Business Dynamics Statistics is only available at a metro level, all metros in the Washington-Arlington-Alexandra metro received the same score in this metric.
WFO
Mixed-use office buildings: While remote work is Arlington’s main draw, 59% of its office properties are mixed-use, which means they're more likely to also house retail establishments that can enhance workers’ office-going experiences or even include apartments for a full live-work-play experience. Many of these buildings are concentrated in the Rosslyn neighborhood, highlighting it as a great shopping destination, in addition to being a business district.
Quality office space (Class A/A+): Two-thirds of Arlington office spaces are rated Class A or A+, demonstrating a preponderance of quality offices on the market. This translates into better locations, amenities and design, all of which can contribute to productivity and work satisfaction.
Office parking availability: Arlington has a ratio of 1.6 parking spaces per 1,000 square feet of office space — the lowest parking availability in the top 20 with the exception of Seattle. Difficulty in getting a parking spot can discourage working in-office when public transportation isn't an option.
Public transit cost: The Washington, D.C.-Arlington-Alexandra metro area has the highest average public transit cost on the entire East Coast.
WFH
Share of remote workers: Cary has the largest share of remote workers among U.S. cities with more than 100,000 residents at 41.4%, ahead of locations like Berkeley, Calif. (36.4%) and Seattle (38%). The place of remote work in the local economy is evident from that figure alone, which is supported by the area's status as an innovation hub driven by information technology and biotech.
Average apartment size: The city has the largest average apartment size at 1,008 square feet. It’s also one of only six cities with more than 100,000 residents in the U.S. to have an average apartment size of more than 1,000 square feet. As an added bonus, Cary is also the most affordable location in the U.S. rent-wise, as median rent here costs 14.8% of household income.
Park density: According to the Trust for Public Land, the city has the lowest number of parks and green spaces per capita in the top 20, which affects telecommuters who prefer working or relaxing outdoors.
WFO
Public transit cost: Of our top 20, Cary has the second-cheapest public transit fare for a one-way trip, thereby drawing attention to public transportation as a cheap option for commuters near one of GoCary's 13 bus routes.
Mixed-use office buildings: Fewer than 10% of office buildings in Cary are mixed-use with retail or other types of space in addition to offices. That may be because office space in the city is mostly located in office parks rather than office towers in the business district. However, this fact can still take away from the convenience of ground-floor shops or restaurants.
WFH
High-speed internet coverage: Salt Lake City boasts a 98.6% high-speed internet coverage with providers including Google, Quantum Fiber, Xfinity and more. With that, individuals logging into work from home, cafes or coworking offices are more likely to enjoy high upload and download speeds.
Free Wi-Fi: The city’s remote-work readiness is further enhanced by its high density of free Wi-Fi access points, coming in at more than 675 hotspots per 100,000 residents — the third-highest density nationwide and the second-best among the 20 best cities for mixing WFH and WFO.
Average apartment size: The average apartment in Salt Lake City is around 804 square feet, which is considerably less than the 854-square-foot average across all 210 cities in the study. This means that apartments along Salt Lake City's famous blocks have fewer rooms, on average, which offers leeway for home offices and/or increases costs for roommates.
WFO
Commute time: The average commuter in Salt Lake City spends just under 20 minutes on their way to or from work, as compared to 24.3 minutes, on average, in the top 20. While seemingly insignificant, 4.3 minutes saved per commute can add up to 37 hours per year that would have been spent in traffic.
Home ownership affordability: Salt Lake City has the second-highest discrepancy between the median housing value and median salary, meaning that residents have lower purchasing power for housing as compared to other cities on the list.
WFH
Remote work-friendly businesses: With robust presences from industries like fintech and IT, as well as a concentration of government and corporate sector jobs, Alexandria’s job market is on the remote-ready side. Note: Because the U.S. Census Bureau’s Business Dynamics Statistics is only available at a metro level, all metros in the Washington-Arlington-Alexandra metro received the same score in this metric.
Coworking availability: Digital nomads and remote workers on the go will be glad to learn that Alexandria has the fifth-best score for coworking spaces per capita in the top 20. That means plenty of high-end, flexible office spaces complete with vibrant work communities, like ALX and Expansive in the city's Old Town.
Average apartment size: Alexandria scored above-average in most of our WFH-related metrics. Still, one weaker showing was in apartment size as the average unit here stands at 854 square feet, which is below the midway point among the top 20 cities.
WFO
Mixed-use office buildings: For those looking for a quick lunch on location or a post-work shopping spree, Alexandria has the top 20’s fourth-highest share of office buildings containing retail or other commercial real estate assets besides office.
Public transit cost: As is the case with its neighboring entries, Alexandria’s WFO score was dragged down by the D.C. metro area’s high public transportation fares. So, while residents have multiple public transportation options — including Metrorail, Metrobus and more — these come at a comparatively high cost.
Commute time: A one-way commute in the city takes an average of 28.7 minutes spent in traffic or on public transportation — the second-longest commute time in the top 20.
WFH
Average apartment size: The average apartment in the 200,000-resident Overland Park spans 971 square feet — the second-best showing in the top 20 in that category.
Coworking availability: Coworking aficionados in Overland Park don’t have as much variety as other top-ranking locations in the U.S., which makes a home office more of a necessity for remote workers looking for focus. Still, locals have options like Serendipity Labs and Office Evolution in South Overland Park, or they can experience one of Kansas City's coworking offices just 12 miles north via I-15.
Free Wi-Fi: Overland Park also has one of the lowest densities of free Wi-Fi access points in the top 20, although it still surpasses St. Louis, Mo., and Frisco, Texas, in that regard.
WFO
Commute time: Overland Park evidences itself as a prime commuter suburb of Kansas City, boasting one of the lowest commute times in the nation for cities around 200,000 residents at 19.4 minutes per one-way trip.
Office parking availability: Once you get to work, the city also offers plenty of parking spaces adjacent to its office buildings. With 3.8 parking spaces per 1,000 square feet of office space, Overland Park ranks second in the top 20 for this metric, only surpassed by Plano's 3.9 spaces per 1,000 square feet of office space.
City amenities & establishments: One area where Overland Park didn’t fare as well was in amenities and establishments that encourage working in-office. More precisely, daycares, entertainment venues and restaurants are in shorter supply here, with the Kansas City suburb having the lowest density of such locations in the entire top 20, thereby influencing its WFO score and its overall finish.
WFH
Park density: Forest Park, Carondelet, Tower Grove and Lone Elk are just a few of the more than 100 parks in St. Louis that total almost 3,000 acres. Whether you find your work inspiration amid nature or it’s your favorite way to unwind after you log off, the city has a lot to offer, as demonstrated by its first-place finish for parks per capita in the top 20.
Free Wi-Fi: While green spaces are easy to find in St. Louis, the same isn’t true for free Wi-Fi networks. As a matter of fact, with a ratio of just 72 networks per 100,000 residents, the city has the second-worst showing in this metric among the 20 best cities for mixing WFH and WFO.
Average apartment size: At 809 square feet, on average, St. Louis’ apartments are on the smaller end, which can pose difficulties for fully remote workers who need peace and quiet for full concentration.
WFO
Home ownership affordability: St. Louis has the second-most affordable homes in the top 20 compared to residents’ median income. As such, prospective homeowners could get a larger or more well-positioned home for the same budget compared to other locations.
Public transit cost: For those preferring public transportation, such as the city’s MetroBus and MetroLink services, a big upside is their affordability: St. Louis boasts the cheapest one-way public transportation tickets among all of the nation’s cities with 100,000-plus residents. This, compounded with great showings in other metrics, cemented St. Louis status as the fourth-best city out of 210 for working in-office.
Unemployment: The city’s score was somewhat dampened by its above-average unemployment, situated at 4.4%, according to the U.S. Census Bureau.
WFH
Average apartment size: At 962 square feet, the average Orlando apartment is more than 100 square feet larger than the average apartment across all 210 cities in our study. That means more possibilities for a home office that boosts focus or splitting bills with an extra roommate.
Rent affordability: Although Orlando’s apartments are comfortably roomy, they’re not very affordable: Median rent in the city takes up 29.3% of the median salary, making for the lowest affordability among the 20 top cities outside Miami.
High-speed internet coverage: Digital nomads in Orlando should also be aware that only 40.6% of the city’s area is serviced by high-speed internet, as compared to 80.7% in Fort Lauderdale, Fla., and 85% in Miami.
WFO
Share of on-site workers: Like its fellow Florida entries, Orlando benefited more from its WFO score than its WFH showings. In fact, Orlando 32.6 WFO points surpassed Miami’s 31.6 points, with the Central Miami entry having a higher share of on-site workers at 82.8%.
City amenities & establishments: Orlando’s large number of office workers is likely driven by its advantages when it comes to after-work fun. That's because Disney World and SeaWorld are far from the only attractions in the city, as Orlando boasts more than 1,100 venues and office work-friendly amenities per 100,000 residents. This ratio is only surpassed by fellow Sunshine State entries Fort Lauderdale and Miami, making The City Beautiful one of the country's top destinations for thrill-seekers, foodies and more.
Home ownership affordability: Unsurprisingly given the city’s comparatively high rental costs, housing affordability in Orlando is also below average.
WFH
High-speed internet coverage: Plano evidenced itself as a good contender for remote workers with good scores across the board, including in remote worker share, rent affordability and average apartment size. Its best showing, however, was in high-speed internet coverage, where it received 4.4 out of a maximum of five points for its 87% coverage of quality internet availability.
Remote work-friendly businesses: Housing headquarters of Dr. Pepper, Frito-Lay, JCPenney, Toyota America and more, business diversity in Plano is boosted by corporate headquarters, as well as finance. That said, the city’s economy is still mostly based around industries that aren’t as remote-ready.
WFO
Office parking availability: With 3.9 parking spaces per 1,000 square feet of office space in Plano, the city offers the highest parking availability around office properties in the top 20, benefiting commuters relying on personal cars.
Quality office spaces (Class A/A+): Office workers here also stand to gain from a great availability of quality office spaces rated Class A or A+. Almost 70% of offices in Plano belong to those categories — a share that's greater than those in Chicago and San Francisco. Top-tier office properties here include Granite Park in the city's northwest, as well as the glass towers of the Downtown Plano Arts District.
Mixed-use office buildings: Yet, while Plano’s office buildings are well-positioned and amenity-rich, they generally don’t benefit from having retail spaces, hotels or other commercial types on location. To that end, fewer than 10% of Plano office buildings are mixed-use, making for one of the weaker showings on the list in that category.
WFH
High-speed internet coverage: The second-best coverage for high-speed internet connections in the top 20 belongs to Hillsboro, where great plans from several providers — including the city-owned HiLight fiber network — ensure quick connections.
Park density: Residents of Hillsboro — the smallest city in the top 20 at approximately 107,000 residents — have many options to choose from when it comes to spending time in nature. The Trust for Public Land places the city’s park density above locations like Bellevue, Wash., or Salt Lake City.
Coworking availability: At the same time, local telecommuters who prefer occasionally logging in from a coworking office may find Hillsboro’s low variety in terms of flexible offices to be a drawback: The city has the third-lowest coworking density per capita among the 20 best cities for combining WFH and WFO.
WFO
Office parking availability: Hillsboro has the fifth-highest parking density around office buildings in the top 20, which is one less thing to worry about for office workers commuting by car.
Commute time: Whether they’re working locally or in Portland, Hillsboro residents enjoy relatively short commutes. Specifically, a trip to work here takes 22.4 minutes, on average, which is one of the better showings on the West Coast.
Quality office space (Class A/A+):Well-positioned office space that offers more amenities and better décor can contribute to a willingness to come into work, rather than log in from home. Here, more than one-third of office space in Hillsboro is rated Class A or A+ — one of the weaker showings in that category.
WFH
Rent affordability: Another commuter town in the Dallas-Fort Worth area to crack the top 20, Frisco’s main draw for telecommuters looking to settle down in the Metroplex is its comparative affordability. The U.S. Census Bureau reports that the median gross rent takes up 15.2% of the average household’s income here for the second-best score in that category among the 20 cities ranking highest.
Share of remote workers: Frisco is one of the largest centers of remote work nationwide, consistently ranking as one of the country's areas with the best remote work adoption. Concentrating a large number of the telecommuters in the DFW area, it has the second-largest percentage of remote work adoption in the U.S. at around 40%.
Free Wi-Fi: With great showings in rent affordability, as well as share of remote workers and average apartment size, Frisco could have ranked among the best WFH cities. However, the city was dragged down by its low scores in the free Wi-Fi, park density and coworking metrics.
WFO
Quality office space (Class A/A+): With ample efforts to redevelop the city's downtown, Plano offices are entering a new age. As things stand, almost three-quarters of office space in Frisco is Class A or A+, which is significantly more more than in Dallas (52.8%), Fort Worth (44%) or nearby Plano (69.4%).
Office parking availability: Frisco also offers a large ratio of parking spots relative to its office inventory, which is a great thing to have given the fact that most workers in the Metroplex commute by car.
Travel time to work: Time spent in traffic is one of the main drawbacks of working on-site in Frisco, as the average, one-way commute time of 27.6 minutes is on the higher end of the spectrum on our list.
WFH
Free Wi-Fi: Many libraries, cafes and even public parks — like Harmon Field and Colonial Lake — offer free Wi-Fi in Charleston, making it one of the most digitally-ready cities on the list with 419 free Wi-Fi hotspots per 100,000 residents. This ensures that local remote and hybrid workers have the means to log in and get their work done, even if they're not at home.
Average apartment size: Or, for those who would rather work from home, Charleston’s apartments are larger than average at 935 square feet or around 80 square feet above the average across all 210 cities in the study.
High-speed internet coverage: With 43.4% of locations serviced by high-speed internet, not all remote workers in the city have great internet connections. So, for telecommuters who need to send or receive files, participate in high-quality video calls or handle other work activities requiring fast internet connections, that’s something to keep in mind.
WFO
Mixed-use office buildings: Office life combines with high-end shopping and nightlife along Charleston's historic King Street and the rest of the city's downtown. In fact, approximately 31% of office properties in Charleston are mixed-use, thereby enhancing the office-going experience and potentially encouraging higher office attendance among hybrid workers.
Public transit cost: The South Carolina city scored well for its average public transit fare, which includes bus and free shuttle services. While most Charleston residents still drive to work, cheap prices make public transportation a viable choice for commuting.
Home ownership affordability: Homes in Charleston are more expensive in relation to median household incomes, and renting isn’t very accessible in relation to median income either.
WFH
Share of remote workers: Located in one of the innovative hotspots of the West Coast, it comes as no surprise that Bellevue has a high degree of remote work adoption. Here, 38.6% of the city’s workers are classified as remote by the U.S. Census Bureau, and the city has the third-highest share of remote workers among all U.S. cities with more than 100,000 residents. With that figure, Bellevue also surpasses Seattle’s remote work adoption of 36%.
Average apartment size: Bellevue has lots going for it when it comes to being remote-work friendly, but the average apartment size in the city is one of its main drawbacks: At 841 square feet, the average apartment here is slightly smaller than the national average, and focus can be harder to find when sharing a smaller home with roommates or family.
WFO
Quality office space (Class A/A+): Bellevue derived most of its total score from its WFH metrics, but its office spaces are nothing to be scoffed at, either. Around 67% of Bellevue offices are Class A or A+, making for a much better office experience for on-site workers. High-rises like City Center Plaza and the Expedia Building are just a few examples of Class A and trophy offices in Bellevue that offer much more than the bare minimum for office-goers.
Home ownership affordability: For workers looking to become owners in Bellevue, the local housing market is challenging even for the West Coast. In fact, the city’s median housing price to median household income ratio is the highest in the top 20, faring worse than even Seattle or Miami.
WFH
Rent affordability: The third location from the Lone Star State to make the top-20 list is also a smaller-sized city benefiting from its location in the Texas Triangle. If you’re a remote worker looking for a more affordable area in the Houston metro, Sugar Land may be the answer: The city offers the second-best rent affordability in Texas after Frisco, as well as the fifth-best nationwide when looking at cities with more than 100,000 residents.
High-speed internet coverage: At the same time, if high-speed internet is a necessity in your field of work, Sugar Land may pose problems. That's because a coverage of around 41% means that while high-speed fiber or Wi-Fi is available in some locations, they’re by no means the rule. Still, the Sugar Land FiberCity project (in conjunction with efforts from providers) is working toward making fiber internet more widely available citywide.
WFO
Home ownership affordability: In the same vein as the city’s rent affordability, on-site workers who want to stay in Sugar Land and become homeowners will find it more affordable on average based on the city’s median home value and median household income.
Commute time: Living and going to work in one of the state’s fastest-growing areas comes at the cost of longer commutes. The average Sugar Land commuter spends 28.5 minutes to get to work, which is well above average, even for Texas standards.
WFH
Park density: The Emerald City didn’t receive its nickname on a whim. If you find it easiest to get inspired and productive amid nature, Seattle’s 116 parks per 100,000 residents equate to lots of variety. Accordingly, the city’s great showing in this metric contributed the most points to its WFH score.
Average apartment size: Seattle has the smallest apartments, on average, among the top 20 and the fourth-smallest nationwide at just 675 square feet — more than 150 square feet below the national average. So, if your home is also your workplace, that means less room to set up and get productive.
WFO
Mixed-use office buildings: More than 49% of Seattle’s buildings are mixed-use. That puts shopping, dining and other activities within easier reach for the city’s on-site and hybrid workers. From ground-floor retail along Fifth and Sixth Avenues downtown to other top areas for shopping and dining, like Ballard and Fremont, office buildings aren't just a place to go to work to in Seattle.
Quality office space (Class A/A+): Another boost to Seattle’s WFO score was provided by its high-quality office spaces, almost 73% of which are Class A/A+. Trophy office space projects — like the Qualtrics Tower and Rainier Square tower — further boosted the city's already rich offering of high-tier office space.
Office parking availability: Seattle could have earned a much higher WFO score — and a higher standing in the top-20 list for cities mixing WFH and WFO — if not for below-average showings in several metrics, such as city amenities and establishments or its office parking ratio, which is the lowest in the top 20. Still, it’s worth noting that a potential solution for the lack of parking can be found in the city’s public transit system, which is among the best on the West Coast.
WFH
High-speed internet coverage: Knoxville is, in essence, an office-worker city, receiving the lowest WFH score in the entire top 20 with a remote work share of just 12.7% of the workforce. Even so, one of the upsides for the city’s remote workers is the wide availability of fast internet, which is among the highest in the region, with fiber plans from providers like AT&T and KUB.
Remote work-friendly businesses: Knoxville’s scarcity of remote jobs can be at least partly explained by its business composition. The city has the top 20’s lowest density of businesses in remote work-ready fields like IT, finance or professional services.
WFO
Public transit cost: On the opposite end of the spectrum, Knoxville’s excellent work-from-office score was driven by several high scores, including the cheapest average public transportation fare among the 20 best cities for combining WFH and WFO. Here, the Knoxville Area Transit operates both bus and trolley lines, granting an extra option for the city’s commuters.
Share of on-site workers: In support of its high WFO score, Knoxville has the highest share of on-site workers in the top 20 at 87.3%. Major employers in the area include the U.S. Department of Energy; health providers like Covenant Health or University Health; and educational institutions, which explains the large share of on-site work present here.
Commute time: Despite the fact that a majority of the city’s nearly 200,000 residents work on-site, commute times remain fairly short in Knoxville. Specifically, a resident can expect to spend just under 20 minutes on their way to work, on average, which is the best showing among the 20 best-ranking cities after Madison, Wis., and Overland Park, Kan.
Quality office spaces (Class A/A+): One area that Knoxville could fare better in for in-office work is high-standard office spaces. Just 21.3% of Knoxville offices are Class A/A+, meaning that most office workers don't enjoy the best when it comes to workspace quality and positioning.
WFH
Park density: A considerable share of Madison's city area is taken up by parks, green spaces, botanical gardens and more. Therefore, the city's great showing in this metric comes as no surprise. With 110 parks per 100,000 residents, Madison ranked fifth out of 20 in that metric.
High-speed internet coverage: The city’s high-performance internet coverage stands around 41%, so some area research may be required for remote workers who need fast internet to do their job.
WFO
Commute time: Despite being slightly larger in population than average among the top 20 cities, Madison has the shortest one-way commute at just 19.3 minutes. Compared to the top-20 average of 24.3 minutes, that’s more than 43 hours saved per year in traffic or on public transportation. What's more, Madison is great in terms of commuting options, as alternatives like public transportation or even biking are viable here.
City amenities & establishments: While Madison scored above average in other WFO metrics — like share of on-site workers and home ownership affordability — its final score was dragged down by a relatively low density of office-supporting amenities and quality office spaces.
WFH
Park density: The entry closing out the top 20 has the second-best public park density after St. Louis with almost 122 parks per 100,000 residents. That places Cincinnati in the top 10 among all 210 cities on the list for park density with must-see parks and trails including the scenic Riverwalk and the nearly 1,500-acre Mt. Airy Forest.
Remote work-friendly businesses: Employment in Cincinnati is largely driven by industries that rarely offer remote work options, such as manufacturing and retail trade.
WFO
Share of on-site workers: As is to be expected given the city’s economic composition that's reliant on manufacturing and retail, most Cincinnati residents — 84.4%, to be exact — work on-site. Consequently, the city derived most of its total points from its WFO score.
Quality office space (A/A+): At the same time, it’s worth noting that many office workers here don’t enjoy the upsides of a Class A or A+ office space, as only 38.5% of the city’s offices belong to those categories.
Didn’t find your city among the top 20? The following table contains the scores of all cities with more than 100,000 residents with complete data.
Arlington, Va. Earns Highest WFH Score in U.S.; Birmingham, Ala. Leads WFO Section
Ranking fourth on the national list for combining working from home and in the office, Arlington, Va., received the majority of its score from work-from-home metrics to earn the highest total on that list. Meanwhile, Birmingham, Ala., had the highest score for on-site work, but stopped at #64 on the combined ranking for cities mixing WFH and WFO due to a weaker WFH score.
The table below contains the 20 best-scoring cities in both categories and the metrics that contributed to their scores. Use the tabs above the table to switch between the WFH and WFO lists.
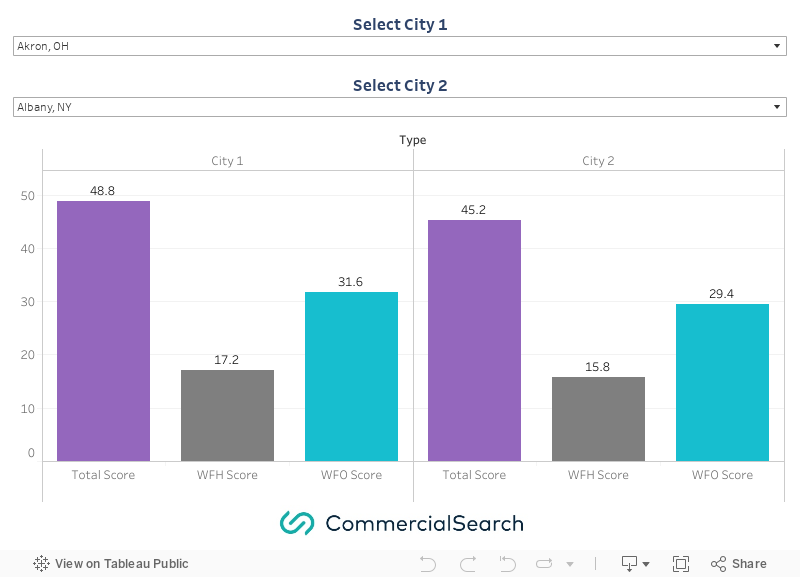
Our ranking included all U.S. cities with more than 100,000 residents and with complete data across all metrics. You can compare the WFH, WFO and total scores of any two cities in our ranking with the following interactive tool:
Methodology
Our analysis included the 210 cities across the United States with at least 100,000 residents and with complete data across all of our metrics.
We awarded each city two separate scores — one for its work-from-home conditions and infrastructure (WFH score) and one for its work-from-office conditions and infrastructure (WFO score). Each city could earn up to 50 points in either category based on its performance across our metrics. The 210 cities were then ranked based on the sum of their WFH and WFO scores.
WFH score metrics included:
- Share of remote workers: Up to 10 WFH points were awarded for the percentage of a city’s population listed as working remote, according to U.S. Census Bureau data. A city’s WFH score for its share of remote workers and its WFO score for its share of on-site workers are inversely proportional and always add up to 10. For example, Cary, N.C. — the city with the highest remote worker share across all 210 cities — received 10 points for its share of remote workers and zero points for its share of on-site workers. Frisco, Texas — the city with the next-highest remote worker share — received 9.5 points and 0.5 points, respectively, and so on.
- Rent as % of household income: Up to 5 WFH points were awarded inversely proportional with the percentage of a city’s median household income that was taken up by that city’s gross median rent, according to U.S. Census Bureau data. Gross rent is defined as contract-listed rent plus the estimated average monthly cost of utilities and fuels.
- Average apartment size: Up to 5 WFH points were awarded for a city’s average apartment size, according to proprietary data provided by Yardi Matrix. This only includes apartments in multifamily units encompassing 50 units or more that were completed as of the end of 2023.
- Coworking density: Up to 5 WFH points were awarded for the number of coworking spaces located in a city per 100,000 residents. Data was provided by CommercialEdge.
- High-speed internet coverage: Up to 5 WFH points were awarded for the percentage of locations in a city that providers report are serviced by broadband internet with speeds of at least 1,000 Mbps, or fixed wireless networks with speeds of at least 10 Mbps. Data source: FCC.
- Free Wi-Fi hotspot density: Up to 5 WFH points were awarded for the number of free Wi-Fi hotspots per 100,000 residents. Data source: WiFi Map.
- Park density: Up to 5 WFH points were awarded for the number of parks with public access within a city’s limits per 100,000 residents. Data source: Trust for Public Land.
- Remote work-friendly businesses: Up to 5 WFH points were awarded for the number of businesses that are likely to offer remote jobs based on their industry per 100,000 residents. Data source: U.S. Census Bureau’s Business Dynamics Statistics. Because data is only available at a metro level, all cities in the same metro received the same score in this metric. Remote work-friendly industries were defined as:
- NAICS Code 51: Information
- NAICS Code 52: Finance and insurance
- NAICS Code 54: Professional, scientific, and technical services
- Unemployment rate: Up to 5 WFH points were awarded inversely proportional with a city’s unemployment rate as reported by the U.S. Census Bureau. Note: A city’s unemployment rate awarded it the same points in both the WFH and WFO scores.
WFO score metrics included:
- Share of on-site workers: Up to 10 WFO points were awarded for the percentage of a city’s population listed as working on-site, according to U.S. Census Bureau data. A city’s WFO score for its share of on-site workers and its WFH score for its share of remote workers are inversely proportional and always add up to 10. For example, El Monte, Calif. — the city with the highest on-site worker share across all 210 cities — received 10 points for its share of on-site workers and 0 points for its share of remote workers. Patterson, N.J. — the city with the next-highest on-site worker share — received 9.8 points and 0.2 points, respectively, and so on.
- Housing value to household income ratio: Up to 5 WFO points were awarded inversely proportional with the ratio between median housing value in a city and that city’s median household income for owner-occupied units. Data source: U.S. Census Bureau.
- Quality office space (Class A/A+): Up to 5 WFO points were awarded for the share of office space listed as Class A or A+ out of the city’s total office inventory. This metric only includes properties larger than 25,000 square feet completed by the end of 2023 and with a primary use type listed as office. Data source: CommercialEdge.
- Mixed-use office buildings: Up to 5 WFO points were awarded for the share of mixed-use office properties out of the total number of office properties in a city. Mixed-use office buildings also contain a different class of commercial real estate, most commonly retail space. This metric only includes properties larger than 25,000 square feet completed by the end of 2023 and with a primary use type listed as office. Data source: CommercialEdge.
- Office parking availability: Up to 5 WFO points were awarded for the ratio of total office parking spaces per 1,000 square feet of office space in a city. This metric only includes properties larger than 25,000 square feet completed by the end of 2023 and with a primary use type listed as office. Data source: CommercialEdge.
- Commute time: Up to 5 WFO points were awarded inversely proportional with the mean one-way commute time for on-site workers in the city. Data source: U.S. Census Bureau.
- Average public transit fare: Up to 5 WFO points were awarded inversely proportional with the minimum cost of a one-way public transportation trip with no deductions or surcharges. Data source: American Public Transportation Association.
- City amenities & establishments: Up to 5 WFO points were awarded for the number of amenities, venues and establishments in a city that can encourage or support working from the office rather than from home per 100,000 residents. Data source: U.S. Census Bureau’s County Business Patterns. Amenities and establishments supporting or encouraging on-site work were defined as:
- NAICS code 4451: Grocery and Convenience Retailers
- NAICS code 4452: Specialty Food Retailers
- NAICS code 4561: Health and Personal Care Retailers
- NAICS code 6111: Elementary and Secondary Schools
- NAICS code 6244: Child Care Services
- NAICS code 7121: Museums, Historical Sites, and Similar Institutions
- NAICS code 7131: Amusement Parks and Arcades
- NAICS code 7139: Other Amusement and Recreation Industries
- NAICS code 7225: Restaurants and Other Eating Places
- Unemployment rate: Up to 5 WFO points were awarded inversely proportional with a city’s unemployment rate as reported by the U.S. Census Bureau. Note: A city’s unemployment rate awarded it the same points in both the WFH and WFO scores.