2019 Pricing
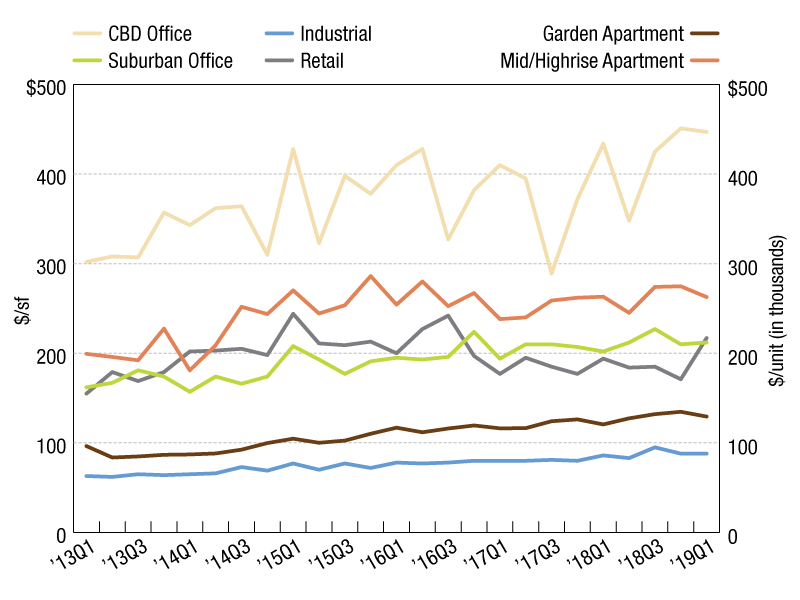
Pricing based on properties and portfolio sales of $2.5 million and greater across multifamily, office, retail and industrial sectors, updated quarterly.
Transaction prices per square foot for office properties overall averaged $263 in 2018, up 6.5 percent year-over-year, according to Real Capital Analytics data. Per-square-foot prices for Office CBD averaged $418 (up by 12.4 percent), while Office Suburban rates averaged $213, up by 3.9 percent compared to 2017. Prices for Industrial properties were $88 per square foot, up slightly by 8.0 percent year-over-year. For Retail asset, prices per square foot remained unchanged year-over-year, averaging $183. Per-unit pricing for Garden Apartments averaged $128,746, down by 5.9 percent over 2017, while unit prices for Mid/High-Rise Apartments were $265,450, down by 5.3 percent year-over-year.
In the first quarter of 2019, overall prices for office properties averaged $272 per square foot, with Office CBD rates at $447 (down 90 basis points quarter-over-quarter), while Office Suburban prices averaged $212 per square foot. Industrial assets averaged $88 per square foot, while Retail pricing was up 27 percent in the first quarter compared to the fourth quarter ($217 per square foot). Prices per unit for Garden Apartments were $129,364 and inched down to $262,755 for Mid/High-rise Apartments (from $274,743 in late 2018).
Overall per-square-foot prices for office properties were $272 as of March, with no changes recorded over February. Rates for CBD Office averaged $447 per square foot, down 13.2 percent month-over-month, while Office Suburban prices reached $212 per square foot (up 5.5 percent). Industrial assets averaged $88 per square foot, while Retail rates were at $217 as of March, up 11.3 percent over February. For residential, prices averaged $129,364 per unit for Garden Apartments (down 1.5 percent) and were at $262,755 per unit for Mid/High-Rise Apartments (down 4.4 percent).
—Posted on May 23, 2019



You must be logged in to post a comment.