2024 New Orders
The latest update based on U.S. Census Bureau data.
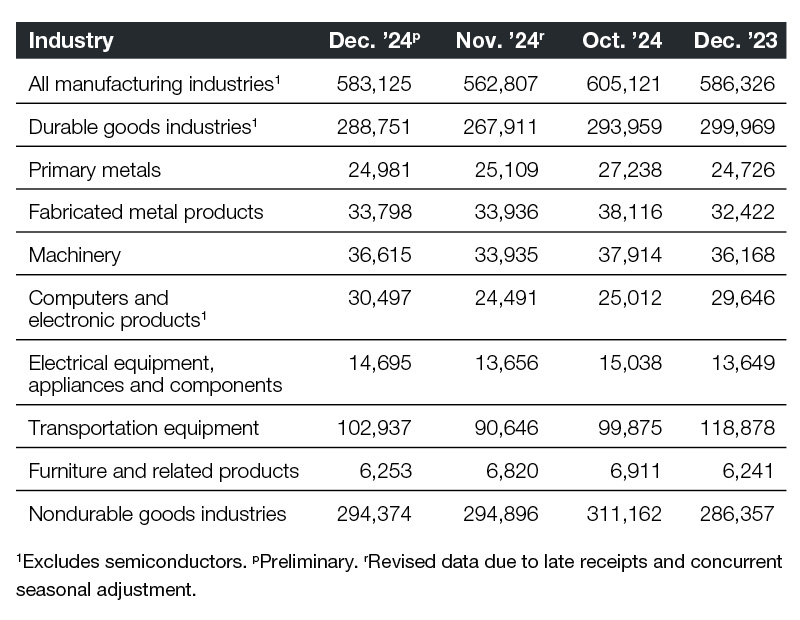
As of December 2024, new orders declined by an average of 0.5 percent year-over-year, amounting to $3.2 million, according to data from the U.S. Census Bureau. Despite this overall dip, certain industries demonstrated notable gains. The Durable Goods Industries sector emerged as the top performer, posting an 11.9 percent increase compared to December 2023. The Electrical Equipment, Appliances and Components category followed closely, registering a 7.7 percent rise, while orders for Machinery expanded by 6.6 percent. Likewise, the Fabricated Metal Products segment recorded a 4.3 percent uptick.
Conversely, the Transportation Equipment sector faced a significant setback, with orders plummeting by 13.5 percent year-over-year. Meanwhile, the Furniture and Related Products category experienced only a marginal increase of 0.2 percent. Orders for Primary Metals inched up by 1.0 percent, while the Nondurable Goods Industries sector saw a 2.8 percent rise. Additionally, the Computers and Electronic Products segment reported a 2.9 percent boost in new orders.
Month-over-month growth
On a monthly basis, new orders increased by 3.6 percent from November 2024, amounting to $20.3 million. Five sectors experienced growth, with two of them recording double-digit gains. The Computers and Electronic Products segment led the way with an impressive 24.5 percent surge, while the Transportation Equipment sector rebounded with a 13.5 percent jump. At the same time, orders for Machinery expanded by 7.9 percent, while the Durable Goods Industries and Electrical Equipment, Appliances and Components sectors registered increases of 7.8 percent and 7.6 percent, respectively.
On the downside, the Furniture and Related Products industry posted the steepest monthly decline, with orders dropping by 8.3 percent. The Primary Metals sector experienced a slight contraction of 0.5 percent, followed closely by Fabricated Metal Products, which dipped by 0.4 percent. Additionally, orders within the Nondurable Goods Industries sector edged down by 0.2 percent.
—Posted on February 26, 2025
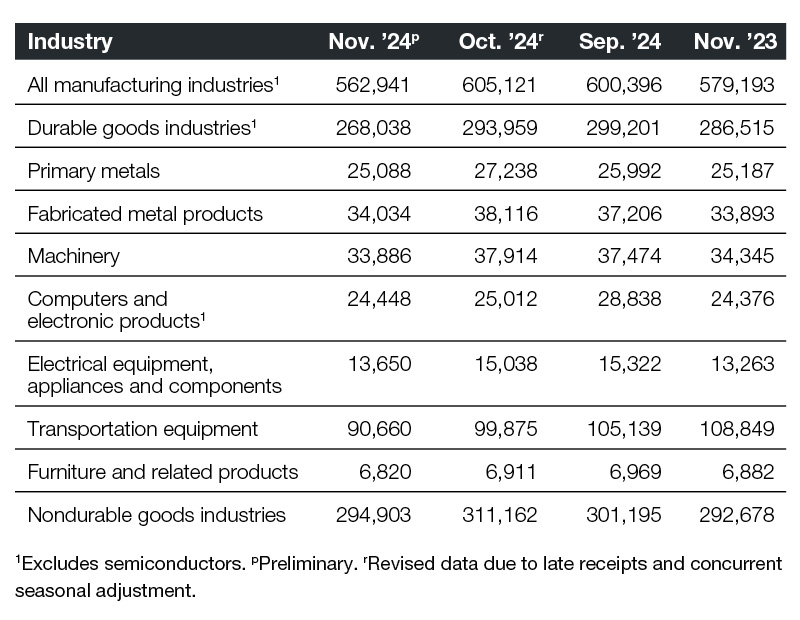
As of November 2024, new orders decreased by an average of 2.8 percent year-over-year, totaling $16.2 million, according to the U.S. Census Bureau. Among all industries, the Electrical Equipment, Appliances and Components sector stood out with a 2.9 percent increase compared to November 2023. The Nondurable Goods Industry category came in second with a modest 0.7 percent gain, while new orders for Fabricated Metal Products rose by 0.4 percent. Similarly, Computers and Electronic Products recorded a slight uptick of 0.3 percent.
In contrast, orders in the Transportation Equipment sector suffered a sharp decline of 16.7 percent year-over-year. New orders for the Durable Goods Industries fell by 6.4 percent, while the Machinery category posted a 1.3 percent drop. Orders for Furniture and Related Products slipped by 0.9 percent, and Primary Metals recorded a slight decrease of 0.4 percent.
Month-over-month growth
Month-over-month, new orders experienced a 7 percent drop compared to October 2024, amounting to $42.2 million. All sectors reported negative growth; Orders for Furniture and Related Products decreased by 1.3 percent, while the Computers and Electronic Products segment recorded a 2.2 percent decrease.
The largest month-over-month losses were seen in the Fabricated Metal Products sector, which fell by 10.7 percent, and Machinery, where orders decreased by 10.6 percent. Both the Electrical Equipment, Appliances and Components and Transportation Equipment sectors posted a 9.2 percent decrease. Additionally, new orders in the Durable Goods Industries fell by 8.8 percent, while the Primary Metals sector contracted by 7.9 percent.
—Posted on January 27, 2025
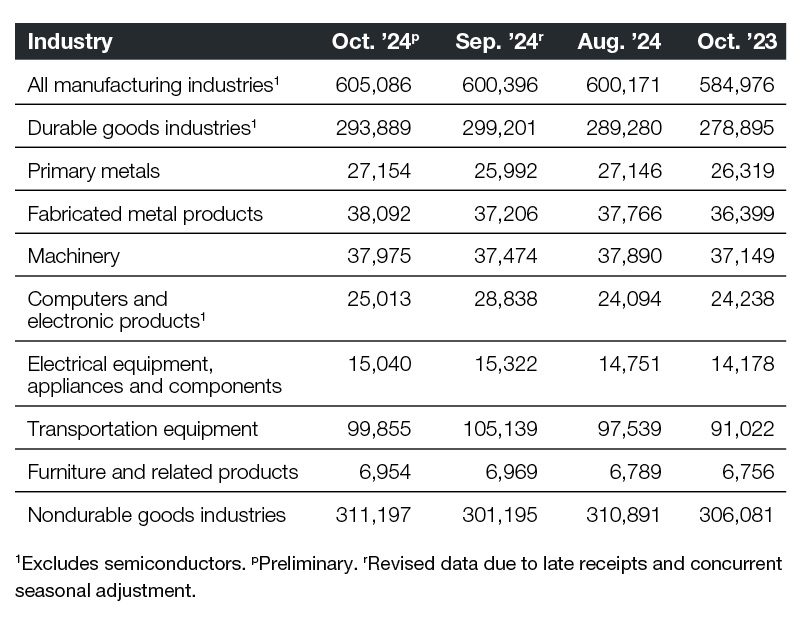
As of October, new orders increased by an average of 3.4 percent year-over-year, totaling $20.1 million, according to the latest data from the U.S. Census Bureau. The Transportation Equipment sector led all industries with a notable 9.5 percent increase compared to October 2023. The Electrical Equipment, Appliances and Components category followed with a 6.1 percent rise, followed closely by Durable Goods Industries, with a 5.4 percent gain. Meanwhile, orders for Fabricated Metal Products saw a 4.7 percent increase.
Primary Metals and Computers and Electronic Products both recorded a 3.2 percent increase, reflecting moderate year-over-year growth. Meanwhile, new orders in the Furniture and Related Products sector expanded by 2.9 percent, while Machinery posted a smaller uptick of 2.2 percent. The Nondurable Goods Industries sector, which accounts for a significant share of manufacturing, grew more modestly by 1.7 percent.
Month-over-month growth
On a month-over-month basis, new orders increased by 0.8 percent when compared to September, or $4.7 million. At 4.5 percent, orders in the Primary Metals sector recorded the highest increase, followed Nondurable Goods Industries, up 3.3 percent. At the same time, orders grew 2.4 percent for Fabricated Metal Products. The Machinery segment also recorded growth, increasing 1.3 percent from the previous month.
However, not all industries performed positively. The Computers and Electronic Products category experienced the steepest drop, falling 13.4 percent compared to September. The Transportation Equipment sector saw a 5.0 percent month-over-month decline, reversing its annual gains. Additionally, the Durable Goods Industries and The Electrical Equipment, Appliances and Components segments contracted by 1.8 percent, highlighting ongoing variability within the manufacturing sector.
—Posted on December 27, 2024
As of September, new orders decreased by an average of 2.1 percent year-over-year, totaling $13 million, according to the latest data from the U.S. Census Bureau. Despite the overall decline, several industries posted notable year-over-year growth. The Computers and Electronic Products sector saw the largest increase, with new orders rising by 2.7 percent compared to September 2023.
This was followed by a 3.4 percent gain in the Electrical Equipment, Appliances and Components category and a 3.3 percent rise in Fabricated Metal Products. The Furniture and Related Products sector also grew by 2.8 percent, while Primary Metals experienced a smaller 1.1 percent increase.
Conversely, the Transportation Equipment sector recorded the sharpest year-over-year decline, dropping by 9.6 percent. Durable Goods Industries and Machinery also saw declines of 2.8 percent and 1.0 percent, respectively. Nondurable Goods Industries, which make up a substantial portion of the manufacturing sector, dipped slightly by 1.4 percent.
On a month-over-month basis, new orders remained relatively flat, inching up by 0.1 percent from August, or $332,000. The Computers and Electronic Products sector led the gains with a significant 19.1 percent increase, while orders in the Transportation Equipment segment grew by 7.8 percent. The Electrical Equipment, Appliances and Components category followed with a 4.6 percent rise.
In contrast, Nondurable Goods Industries posted a 3.1 percent decline, while Primary Metals dropped by 4.3 percent. Meanwhile, Machinery and Fabricated Metal Products recorded slight decreases of 1.0 percent and 1.3 percent, respectively, showcasing mixed results across industries.
—Posted on November 26, 2024
Source: U.S. Census Bureau
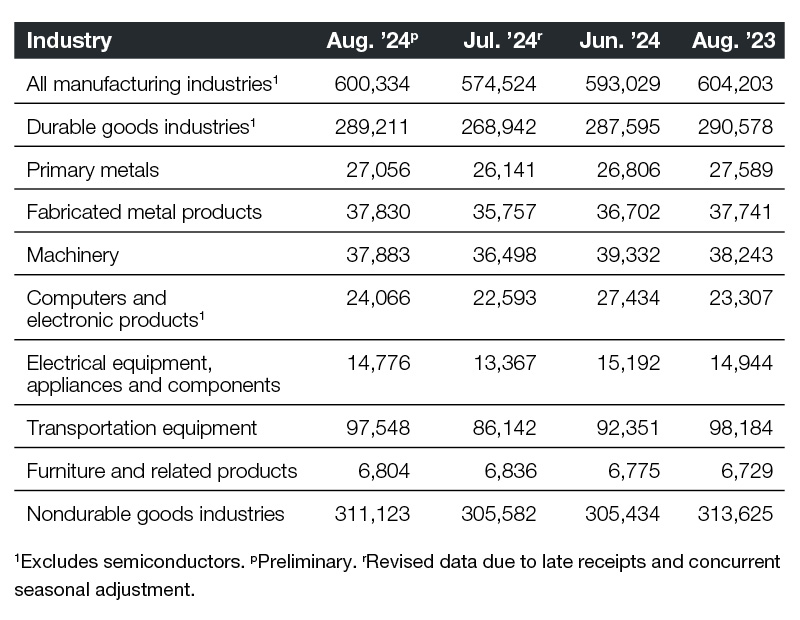
As of August, new orders fell by an average of 0.6 percent, amounting to $3.9 million, based on data from the U.S. Census Bureau. However, three sectors showed improvement compared to August 2023. The Computers and Electronic Products sector saw a significant 3.2 percent increase in new orders, while Furniture and Related Products posted a 1.1 percent gain. Fabricated Metal Products saw a modest 0.2 percent rise.
Year-over-year, nearly all surveyed manufacturing industries experienced negative growth, except for these sectors. The Primary Metals sector faced the steepest decline, with orders dropping 1.9 percent. The Electrical Equipment, Appliances and Components sector saw a 1.1 percent decrease, and the Machinery sector recorded a 0.9 percent dip. Nondurable Goods Industries followed with a 0.8 percent decline, while Transportation Equipment orders fell by 0.6 percent.
On a month-over-month basis, new orders grew by 4.5 percent, totaling $25.8 million as of August. Growth was seen in all but one sectors. Transportation Equipment led with a 13.2 percent surge, followed by a 10.5 percent increase in Electrical Equipment, Appliances and Components. Durable Goods Industries posted a 7.5 percent gain, and Computers and Electronic Products saw a 6.5 percent rise. Fabricated Metal Products orders increased by 5.8 percent.
In contrast, the Furniture and Related Products segment posted the largest monthly decline, falling by 0.5 percent. Nondurable Goods Industries saw a modest 1.8 percent increase, while the Primary Metals sector grew by 3.5 percent. Orders in Machinery rose by 3.8 percent.
—Posted on October 23, 2024

Source: U.S. Census Bureau
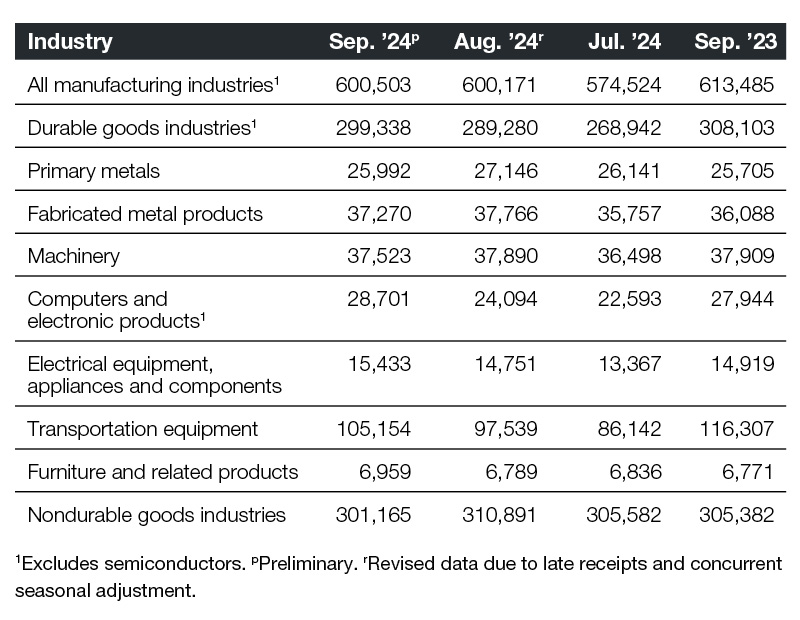
As of July, new orders increased by an average of 3.7 percent year-over-year, totaling $20.8 million, according to the latest data from the U.S. Census Bureau. The largest year-over-year growth was observed in the Furniture and Related Products category, where new orders surged by 7.7 percent compared to July 2023. Meanwhile, the Nondurable Goods Industries sector posted a solid 4.5 percent increase, closely followed by a 4.2 percent rise in the Fabricated Metal Products sector.
During the same period, the Durable Goods Industries segment saw a more moderate 2.9 percent uptick, with Transportation Equipment orders growing by 2.8 percent, Machinery rising by 2.3 percent, and Primary Metals recording a 2 percent increase. Both the Computers and Electronic Products and Electrical Equipment, Appliances, and Components sectors experienced smaller gains, each posting a 1.8 percent rise in new orders.
On a month-over-month basis, new orders decreased by an average of 3.1 percent, or $18.4 million. In contrast to the annual trend, most sectors saw a drop in new orders compared to June 2024. The only exception was the Furniture and Related Products segment, where orders rose by 1.4 percent. Meanwhile, the Nondurable Goods Industries sector remained virtually unchanged.
Across nearly all industries, July recorded negative month-over-month growth. The steepest decline occurred in the Computers and Electronic Products sector, where new orders plummeted by 17.6 percent. Similarly, the Electrical Equipment, Appliances, and Components sector experienced an 11.2 percent drop, while the Machinery sector reported a 7.3 percent decrease. The Transportation Equipment sector saw a 6.7 percent decline, closely followed by a 6.4 percent drop in the broader Durable Goods Industries.
—Posted on September 23, 2024
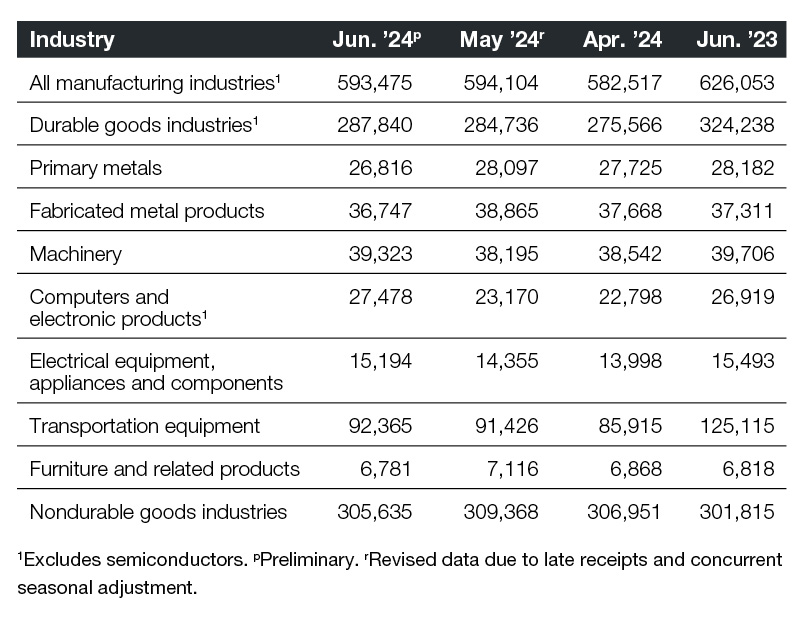
As of June, new orders declined by an average of 5.2 percent, equivalent to a $32.6 million, according to U.S. Census Bureau data. However, there were two sectors that showed improvement compared to June 2023. The Computers and Electronic Products sector experienced a notable surge in new orders, rising by 2.1 percent, while Nondurable Goods Industries posted a 1.3 percent gain.
Year-over-year analysis reveals that nearly all surveyed manufacturing industries experienced negative growth, with only two exceptions. The most significant decline was observed in the Transportation Equipment sector, where orders plummeted by 26.2 percent. Additionally, the Durable Goods Industries recorded an 11.2 percent decrease, and the Primary Metals sector saw a 4.8 percent drop.
On a month-over-month basis, new orders saw a modest decline of 0.1 percent, amounting to $629,000 as of June. The growth in new orders continued to vary across different sectors. The Computers and Electronic Products sector led the increases with an 18.6 percent surge. This was followed by a 5.8 percent rise in the Electrical Equipment, Appliances, and Components sector, a 2.9 percent uptick in Machinery, and a 1.1 percent gain in Durable Goods Industries.
Conversely, the Fabricated Metal Products segment recorded the sharpest monthly decline, falling by 5.4 percent. Orders for Furniture and Related Products decreased by 4.7 percent, the Primary Metals sector dropped by 4.5 percent, and the Nondurable Goods Industries sector experienced a 1.2 percent decrease.
—Posted on August 23, 2024

Source: U.S. Census Bureau
As of May, new orders rose by an average of 0.9 percent, or $5.5 million, according to data from the U.S. Census Bureau. The most substantial increase compared to May 2023 occurred in the Computers and Electronic Products sector, where new orders climbed by 4.1 percent. The Furniture and Related Products segment experienced a 3.6 percent rise, Nondurable Goods Industries grew by 3.1 percent, and Fabricated Metal Products saw a 2.7 percent uptick.
Year-over-year, all but three surveyed manufacturing industries showed positive growth. As of May, the Transportation Equipment sector saw the steepest decline, with a rate of -6.3 percent. Meanwhile, orders in the Durable Goods Industries segment decreased by 1.3 percent, and the Machinery sector recorded a 0.2 percent drop.
On a month-over-month basis, new orders increased by an average of 2.0 percent, or $11.9 million, as of May. Reflecting similar yearly trends, nearly all surveyed sectors experienced an uptick in new orders. Transportation Equipment saw a 6.4 percent increase, Furniture and Related Products grew by 3.6 percent, Fabricated Metal Products and Durable Goods Industries rose by 3.4 percent, and orders in the Electrical Equipment, Appliances, and Components sector increased by 2.8 percent.
The only decline was in the Machinery segment, which fell by 0.8 percent. Orders for Nondurable Goods Industries edged up by 0.8 percent, Primary Metals increased by 1.2 percent, and the Computers and Electronic Products sector rose by 1.9 percent.
—Posted on July 24, 2024

As of April, new orders increased by an average of 3.4 percent, or $19.4 million, according to data from the U.S. Census Bureau. The most significant rise compared to April 2023 was in the Fabricated Metal Products sector, where new orders surged by 5.9 percent. The Nondurable Goods Industries saw a 5.5 percent gain, Primary Metals increased by 5.3 percent, while Machinery saw a 4.1 percent rise.
Year-over-year, all but one surveyed manufacturing industries showed positive growth. As of April, the only decrease came from the Transportation Equipment sector, where the rate stood at -5.3 percent. Meanwhile, orders recorded a 1.0 percent increase for Furniture and Related Products. At the same time, the Durable Goods Industries sector recorded a 1.2 percent increase.
However, on a month-over-month basis, new orders fell by an average of 5.0 percent, equating to $30.9 million as of April. Unlike the yearly trends, all surveyed sectors experienced a decline in new orders. Nondurable Goods Industries saw a 0.3 percent decrease, Primary Metals declined by 0.7 percent, Fabricated Metal Products fell by 2.8 percent, and Furniture and Related Products decreased by 3.4 percent.
The most significant monthly drop was recorded within the Transportation Equipment segment, which plummeted by 19.5 percent. Orders for Computers and Electronic Products fell by 17.7 percent, Durable Goods Industries saw a 9.8 percent decrease, and the Electrical Equipment, Appliances and Components sector decreased by 8.6 percent. Machinery orders also recorded a 4.1 percent decline.
—Posted on June 24, 2024
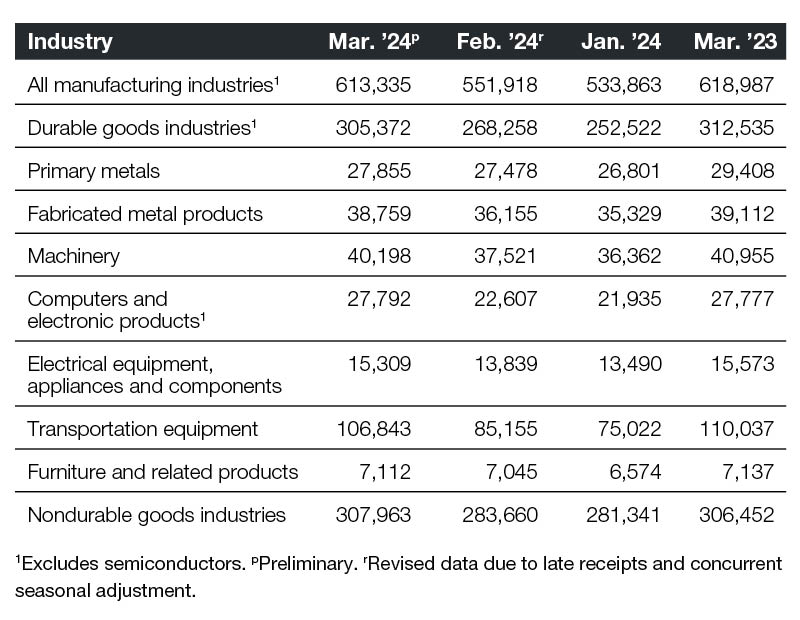
In March, there was a notable downturn in new orders, averaging a decrease of 0.9 percent or $5.6 million, as per data gathered by the U.S. Census Bureau. Comparing this to March 2023, the most significant surge was observed in the Nondurable Goods Industries sector, with new orders rising by 0.5 percent.
When examining year-over-year trends, all surveyed manufacturing industries showcased negative growth patterns, with only two exceptions. The Primary Metals sector saw the steepest decline at -5.3 percent, trailed by Transportation Equipment at -2.9 percent, Durable Goods industries at -2.3 percent, Machinery at -1.8 percent, and Electrical Equipment, Appliances and Components at -1.7 percent. Meanwhile, orders for Furniture and Related Products experienced a slight 0.3 percent decrease.
On a month-over-month basis, new orders increased by an average of 11.1 percent—equal to $61.4 million—as of March. Contrary to yearly patterns, all sectors surveyed experienced growth in new orders. The most remarkable spike was witnessed in the Transportation Equipment sector, which saw a 25.5 percent rise in new orders. Following closely behind was the Computers and Electronic Products segment, boasting a robust 22.9 percent gain. Durable Goods Industries also experienced a surge of 13.8 percent, while the Electrical Equipment, Appliances and Components sector saw a 10.6 percent uptick.
Conversely, other industries experienced growth rates that fell below the double-digit percentage mark. Nondurable Goods Industries observed a commendable 8.6 percent increase, while the Fabricated Metal Products segment saw a 7.2 percent uptick. Similarly, Machinery orders increased by 7.1 percent, while Primary Metals recorded a 1.4 percent rise.
—Posted on May 23, 2024
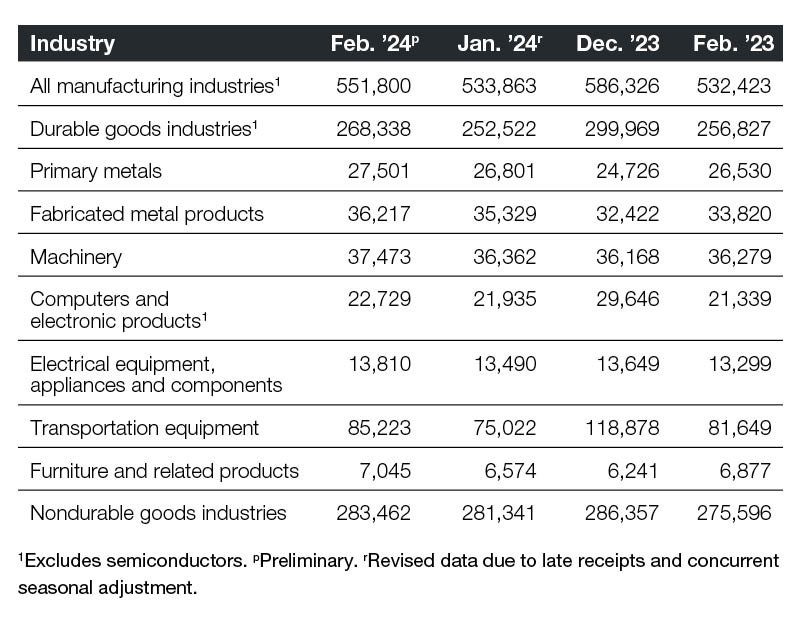
As of February, new orders increased by an average of 3.6 percent, translating to $19.4 million, according to data from the U.S. Census Bureau. Compared to February 2023, the most substantial rise came from the Fabricated Metal Products sector, where new orders climbed by 7.1 percent. The Computers and Electronic Products segment followed with a 6.5 percent gain, Durable Goods Industries recorded a 4.5 percent increase, followed by Transportation Equipment, where orders were up by 4.4 percent.
Year-over-year, all surveyed manufacturing industries displayed positive growth trends. As of February, the smallest increase came from the Furniture and Related Products sector, where the rate stood at 2.4 percent. Meanwhile, orders recorded a 2.8 percent increase for Nondurable Goods Industries. At the same time, the Machinery sector recorded a 3.3 percent increase.
On a month-over-month basis, new orders increased by an average of 3.3 percent—equal to $17.9 million—as of February. Consistent with yearly patterns, all sectors surveyed experienced positive growth in new orders. Transportation Equipment saw the most remarkable surge at 13.6 percent. Orders for Furniture and Related Products climbed by 7.2 percent, Durable Goods Industries saw a 6.3 percent increase, and the Computers and Electronic Products sector posted a 3.6 percent shift. Machinery orders closely followed with a 3.0 percent growth rate.
Meanwhile, orders for the other industries recorded growth rates below the 3 percent mark. Nondurable Goods Industries observed a 0.7 percent increase, while the Electrical Equipment, Appliances and Components segment experienced a 2.4 percent increase. At the same time, orders for Fabricated Metal Products were up by 2.5 percent, while Primary Metals registered a 2.6 percent increase.
—Posted on April 22, 2024
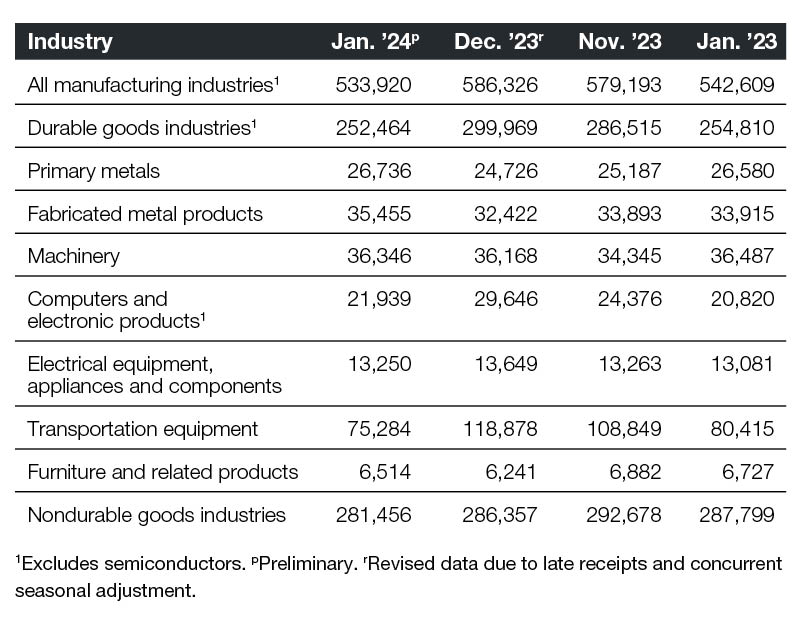
Year-over-year through January, new orders decreased by an average of 1.6 percent, equal to $8.7 million, based on data from the U.S. Census Bureau. The Computers and Electronic Products sector recorded the most significant increase, up by 5.4 percent from January 2023. Fabricated Metal Products followed closely with a 4.5 percent rise. Electrical Equipment, Appliances, and Components saw a 1.3 percent growth, while orders for Primary Metals increased by 0.6 percent.
However, there was inconsistency in the year-over-year changes, with five sectors experiencing declines as of January 2024. Transportation Equipment had the largest decrease, down by 6.4 percent. Meanwhile, orders for Furniture and Related Products declined by 3.2 percent. Nondurable Goods Industries decreased by 2.2 percent, Machinery by 0.4 percent, and Durable Goods Industries by 0.9 percent.
Looking at the month-to-month data for January, new orders showed an uneven pattern, with an average decrease of 8.9 percent, or $52.4 million. Similar to the yearly trend, most industries experienced a decline in new orders, except for four. Fabricated Metal Products saw the most significant growth, up by 9.3 percent. Primary Metals increased by 8.1 percent, while Furniture and Related Products saw a 4.4 percent rise. At the same time, Machinery experienced a 0.5 percent increase.
Conversely, the Transportation Equipment sector experienced a significant decline of 36.7 percent in new orders, followed by Computers and Electronic Products (-25.6 percent) and Durable Goods Industries (-15.8 percent). Electrical Equipment, Appliances, and Components recorded a 2.9 percent drop, while Nondurable Goods Industries decreased by 1.7 percent.
—Posted on March 22, 2024


You must be logged in to post a comment.