3 Capital Markets Trends to Watch in 2018
CBRE Vice President Brandon Smith identifies the capital markets trends set to impact the multifamily industry next year and analyzes the real estate market's reaction to the new Fed chair.
By Brandon Smith
Multifamily deliveries at peak levels
 New multifamily unit deliveries remain at peak levels, with 261,800 units completed over the past year and starts down only slightly from first-quarter 2017 peak. However, multifamily demand remained very strong—230,400 units were absorbed for the year ending in the third quarter 2017. This is the second-highest four-quarter total during the recovery/expansion period, and up 5 percent from last quarter.
The average monthly effective rent of $1,653 in the 62 markets tracked by CBRE was down by 0.5 percent from the prior year. However, this average is weighted down by year-over-year rent declines in a few large markets; 84 percent of markets are experiencing rent growth. The relatively low national vacancy of 4.6 percent is up marginally from a year ago.
This has a positive impact on multifamily acquisitions going forward. Though activity is below 2016’s peak volume, it has improved in recent months. The third-quarter total of $39.9 billion was 5 percent higher than in third-quarter 2016 and 19 percent higher than in second-quarter 2017.
Homeownership increasing
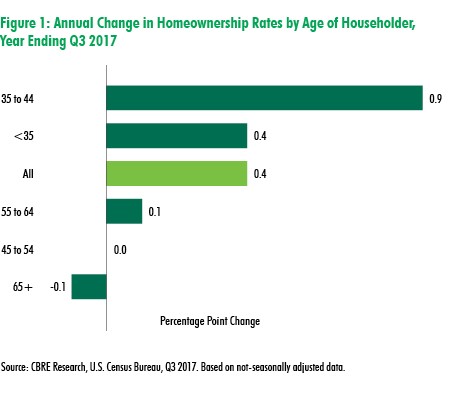
The homeownership rate was 63.9 percent in third-quarter 2017, up slightly from a year ago. While the year-over-year 0.4-point increase in the third quarter was smaller than that of the second quarter, it confirms the beginnings of a trend of rising homeownership. The homeownership low point was 63.1 percent in second-quarter 2016, the lowest level since the U.S. Census Bureau began tracking this metric in the mid-1960s. The high was 69.4 percent in second-quarter 2004.
The year-over-year increase in homeownership was primarily driven by younger households, up 0.9 percent for those 35 to 44 years old to 59.3 percent, and up 0.4 percent for those under 35 years old to 35.6 percent. There was no appreciable change in homeownership rates among the other age cohorts.
Households with incomes above the U.S. median experienced the highest increase, rising to 78.4 percent from 77.8 percent year over year. For households with incomes less than the U.S. median, the year-over-year gain was more modest (from 49.2 percent to 49.5 percent).
Homeownership rates by region:
- West – 58.9 percent
- Midwest – 69.1 percent
- South – 65.5 percent
- Northeast – 60.4 percent
Homeownership rates by city:
- Los Angeles (lowest) – 46.6 percent
- San Jose – 49.9 percent
- New York – 50.3 percent
- Austin 51.9 percent
- Las Vegas, San Diego and San Francisco also had rates under 56 percent
Market welcomes new Fed chair
Largely to the delight of the market, Trump announced Jerome Powell as the next Fed Chair to replace Janet Yellen when her term expires Feb. 3, 2018. The other choices of John Taylor or Kevin Warsh could have caused a negative market response, so his announcement is more about who wasn’t nominated rather than who was nominated.
Powell has voted with the consensus and is likely to maintain Yellen’s policies. But unlike Yellen, he’s a Republican who has argued against banking regulations.
Over Yellen’s four-year term, the Fed started hiking rates and balance sheet normalization, and the market is responding well. The unemployment rate remains low, GDP is trending up and stocks are at all-time highs. Powell will have the benefit of a Congress and White House of the same party, but will have to navigate stagnant inflation, the wind down of the Fed’s balance sheet, and global withdrawal of QE.
Despite low inflation, the Fed continues to send strong signals about the December 15 meeting’s rate hike decision. Markets are now pricing in a near 100 percent probability of a hike in December. Given low inflation and the flattening yield curve, that doesn’t make much sense. However, the market isn’t pushing back too much; They are likely figuring they should squeeze in one more bump during Yellen’s term. The inflation number on November 15 will play into this decision.
The determination to raise rates with low inflation has led to the two-year U.S. Treasury hitting a nine-year high, which results in the flattest yield curve in a decade: the spread between the two-year Treasury and 10-year Treasury is at 0.72 percent—its lowest level since 2007. The increase in short-term rates also has a huge impact for cap pricing and borrowers of short-term, floating-rate loans.


You must be logged in to post a comment.