2019 Development
Year-over-year change in U.S. commercial real estate properties under construction in the industrial, office and retail sectors, updated monthly.
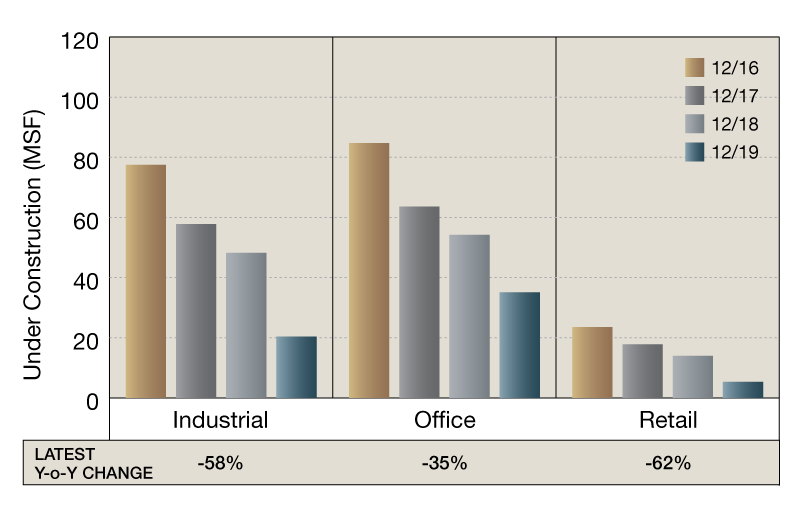
Year-over-year, new development declined on a square-foot basis for all property types. As of December, the retail sector recorded the most significant change (down 62 percent), while industrial construction dipped by 58 percent, according to CoStar information. Month-over-month, construction in the industrial sector decreased by 7 percent, retail development fell by 5 percent, while office construction performance remained flat.
As of December, some 20.4 million square feet of industrial space was under construction nationwide, less than half the amount of space under construction in December 2018. Over the past three years, construction in the industrial sector peaked in December 2016 at 77.5 million square feet. Compared to this cycle peak, development in December 2019 dropped by 74 percent, while compared to December 2017, construction decreased by 65 percent.
—Posted on Jan. 24, 2020
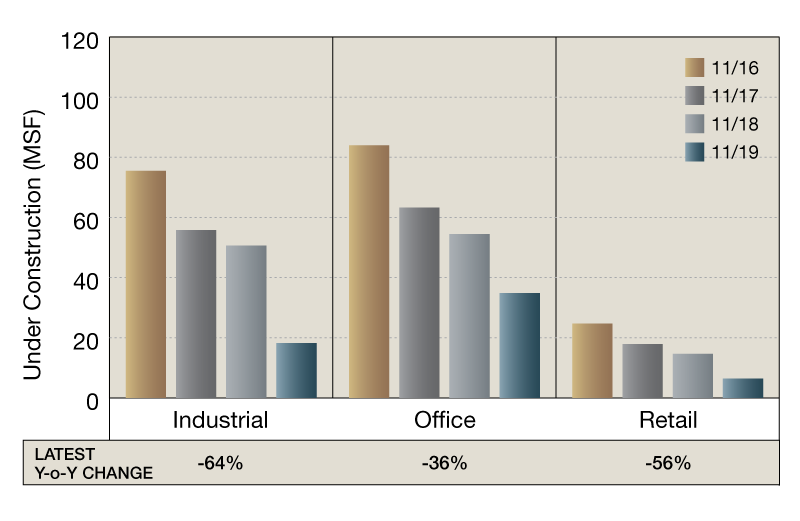
Year-over-year, new development declined on a square-foot basis for all property types. As of November, the industrial sector registered the most considerable change, down by 64 percent, while office construction decreased by 36 percent, according to CoStar information. Month-over-month, construction in the retail sector dropped by 32 percent, industrial development fell by 17 percent and office construction slightly declined (down by 4 percent).
As of November, some 6.4 million square feet of retail space was under construction nationwide. Year-over-year, development activity in the retail sector fell by 56 percent. Over the past three years, construction in the retail sector peaked in November 2016 at 24.7 million square feet. Compared to this cycle peak, development in November 2019 dropped by 74 percent, while compared to November 2017, construction decreased by 56 percent.
—Posted on Dec. 16, 2019
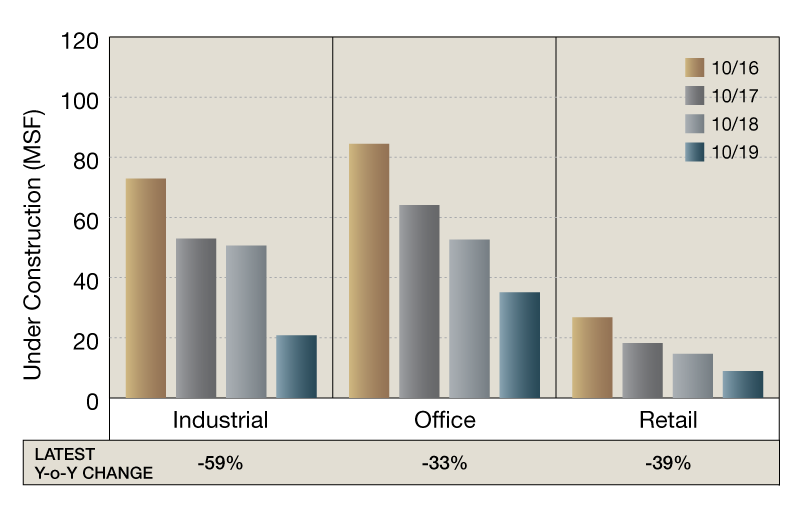
New development declined on a square-foot basis for all property types year-over-year. As of October, the industrial sector recorded the most significant change, down by 59 percent, while retail development fell by 39 percent and office construction decreased by 33 percent, according to CoStar data. On a month-over-month basis, construction in the industrial sector fell by 25 percent, retail development dropped by 11 percent and office construction declined by 8 percent.
Over the past three years, construction activity in the office sector peaked in October 2016 at 84.5 million square feet. Compared to this cycle peak, development in October 2019 dropped by 59 percent, while compared to October 2017, construction decreased by 45 percent. Year-over-year, construction activity in the office sector declined by 33 percent.
—Posted on Nov. 18, 2019
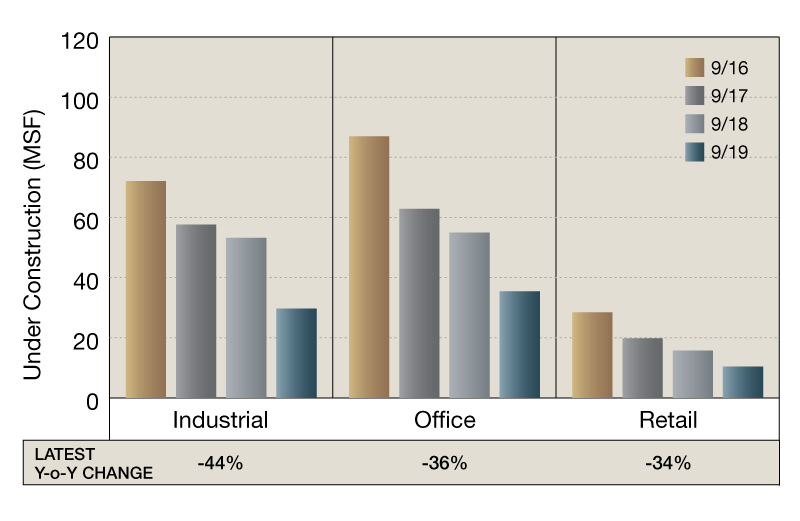
New development declined on a square-foot basis for all property types year-over-year. The industrial sector registered the most considerable change, down by 44 percent, while office development fell by 36 percent and retail construction decreased by 34 percent as of September, according to CoStar information. Month-over-month, construction in the industrial sector fell by 16 percent, retail development dropped by 8 percent and office construction declined by 5 percent.
Over the past three years, construction activity in the industrial sector peaked in September 2016 at 72.1 million square feet. Compared to this cycle peak, development in September 2019 decreased by 59 percent, while compared to September 2017, construction fell by 48 percent.
—Posted on Oct. 25, 2019
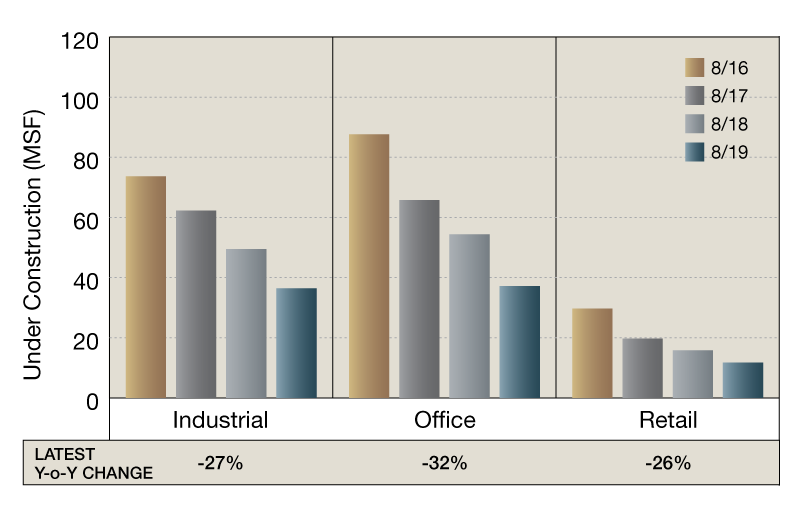
New development declined year-over-year for all property types on a square-foot basis. Office construction recorded the most significant change, down by 32 percent, while industrial development decreased by 27 percent and retail construction fell by 26 percent as of August, according to CoStar information. On a month-over-month basis, industrial construction dropped by 12 percent, retail development declined by 9 percent and office construction fell by 6 percent.
Over the past three years, construction activity in the retail sector peaked in August 2016 at 29.7 million square feet. Compared to this cycle peak, development in August 2019 decreased by 60 percent, while compared to August 2017, construction fell by 40 percent.
—Posted on Sept. 30, 2019
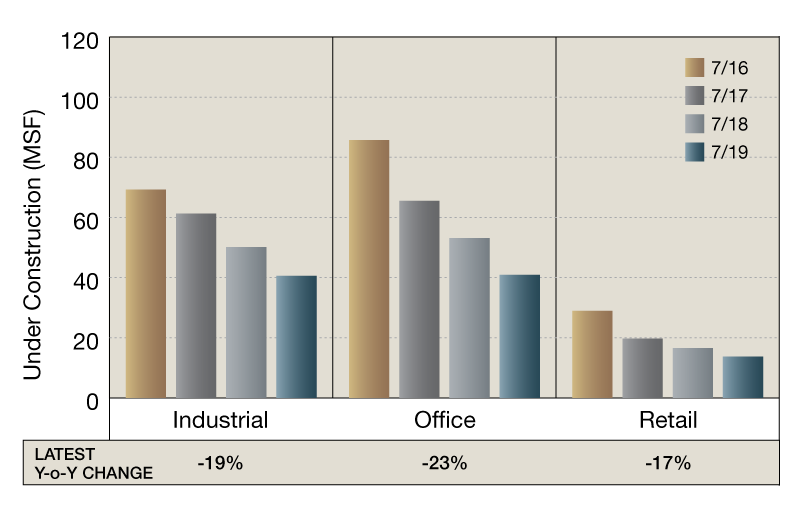
New development declined year-over-year for all property types on a square-foot basis. Office construction registered the most notable change, down by 23 percent, while industrial development fell by 19 percent and retail construction dropped by 17 percent as of July, according to CoStar information. Month-over-month, office construction decreased by 1.5 percent, retail development declined by 1.9 percent and industrial construction recorded the only increase, up by 6.5 percent.
In the past three years, construction activity in the office sector peaked in July 2016 at 85.7 million square feet. Compared to this cycle peak, development decreased by 52.3 percent in July 2019, while compared to July 2017, development decreased by 37.6 percent. Year-over-year, construction activity in the office sector fell by 23 percent.
—Posted on Aug. 22, 2019
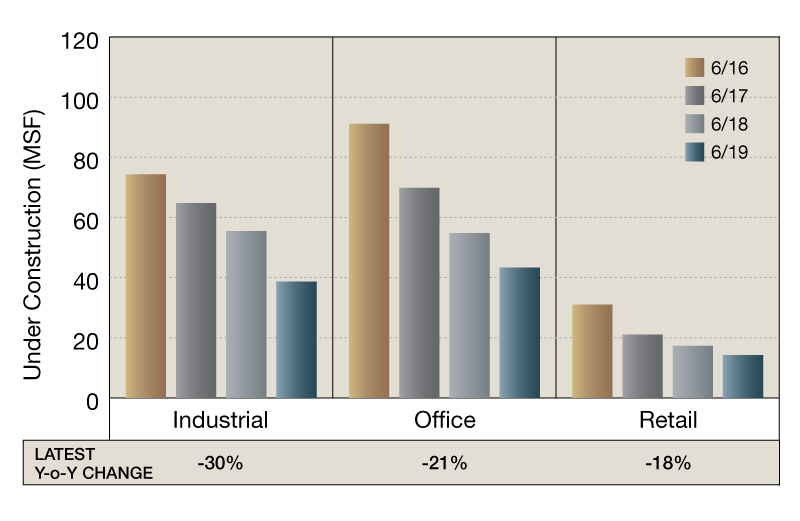
On a square-foot basis, new development decreased for all property types year-over-year, per CoStar data. Industrial construction fell by 30 percent, development in the office sector decreased by 21 percent and retail followed with an 18 percent decrease as of June. Month-over-month, the percentage of office properties under construction dropped by 8.8 percent, followed by softening industrial development (down 1.1 percent). The only increase was in construction activity for retail assets (up 2.7 percent).
Over the past three years, development activity in the industrial sector peaked in June 2016 at 74.4 million square feet. Comparing June 2019 to that cycle peak, construction activity fell by 48 percent, while compared to June 2017, development decreased by 40 percent. In comparison with the same period in 2018, construction in the industrial sector decreased by 30 percent, a sign that industrial development is gradually leveling off.
—Posted on July 24, 209
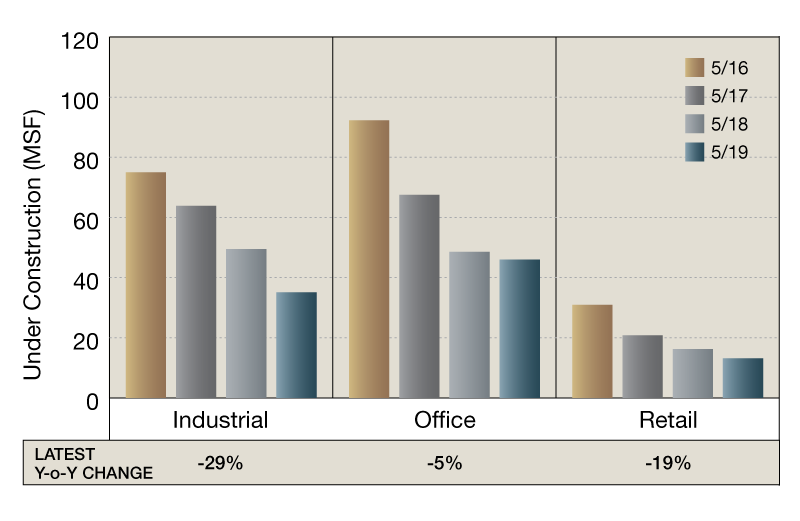
Year-over-year, new development declined all property types on a square-foot basis. Office development registered the smallest change, down by 5 percent, retail construction fell by 19 percent and industrial recorded the most notable drop, down by 17 percent drop as of May. On a month-over-month basis, office construction increased by 2 percent, while retail development declined by 8 percent and industrial construction fell by 12 percent.
In the past three years, construction activity in the retail sector peaked in May 2016 at 30.9 million square feet. Compared to this cycle peak, development decreased by 58 percent in May 2019; compared to May 2017, development decreased by 37 percent. Construction activity in the retail sector decreased by 19 percent from May 2018 to May 2019.
—Posted on June 21, 2019
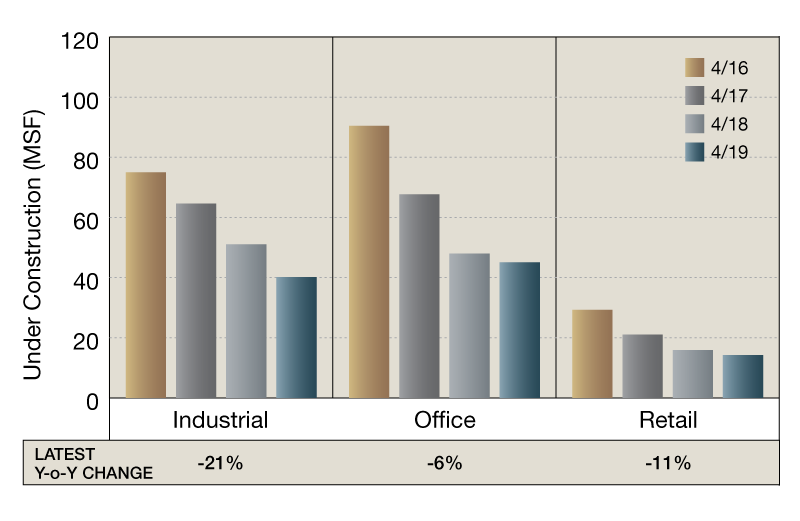
New development decreased on a square-foot basis for all property types year-over-year, according to CoStar Group data. Industrial construction dropped by 21 percent, retail development decreased by 11 percent and office followed with the smallest decrease, down by 6 percent as of April. The share of office properties under construction increased by 4.0 percent month-over-month, followed by industrial development (up by 0.2 percent). Development activity for retail properties declined by 6.2 percent compared to March 2019.
In the previous three years, the office sector peaked in April 2016 at 90.4 million square feet. Compared to this cycle peak, construction activity decreased by 50.2 percent in April 2019. In comparison with April 2017, development activity in April 2019 decreased by 33.4 percent, while comparing April 2019 to the same period in 2018, development activity in the office sector decreased by only 6.1 percent.
—Posted on May 29, 2019
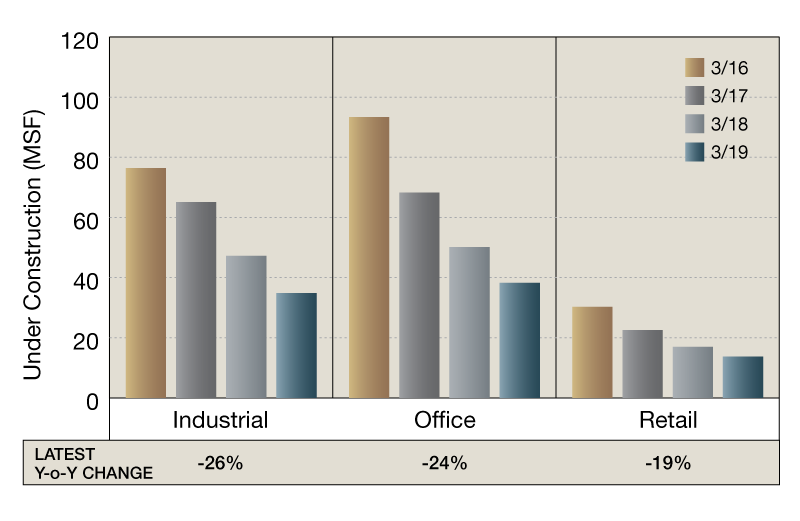
New development decreased on a square-foot basis for all property types year-over-year, according to CoStar Group. Industrial construction fell by 26 percent, office development decreased by 24 percent and retail followed with a 19 percent decline as of March. The share of industrial properties under construction decreased by 7.9 percent month-over-month, followed by office development with a decline of 7.1 percent. Development activity for retail properties recorded a slight decrease of 1.0 percent compared to February 2019. In the past three years, the industrial sector peaked in March 2016 at 76.4 million square feet. Construction activity decreased by 54.4 percent in March 2019, compared to the same month in 2016. In comparison with March 2017, construction decreased by 46.6 percent. Comparing March 2019 to the same period in 2018, development activity in the industrial sector posted a 26.3 percent decline.
—Posted on Apr. 23, 2019
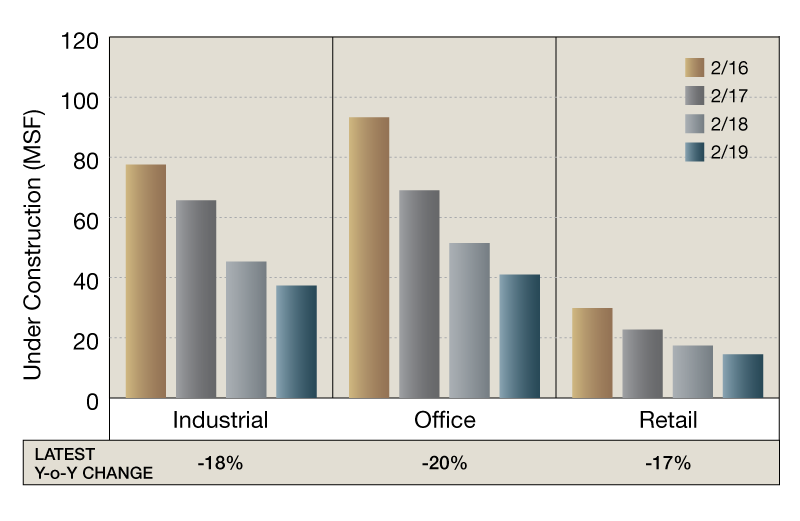
New development declined year-over-year for all property types on a square-foot basis. Office development decreased by 20 percent, industrial construction fell by 18 percent and retail followed with a 17 percent drop as of February. The percentage of retail properties under construction decreased by 11.6 percent month-over-month, followed by office assets (down by 9.5 percent). Development activity for industrial properties registered a 15.8 percent decrease.
In the past three years, the retail sector peaked in February 2016 at 29.9 million square feet. In comparison with the same month in 2017, construction decreased by 23.9 percent. Comparing February 2016 to the same period in 2017, the retail sector experienced a 41.9 percent decline, followed by a 51.6 percent drop in November 2018.
—Posted on Mar. 26, 2019
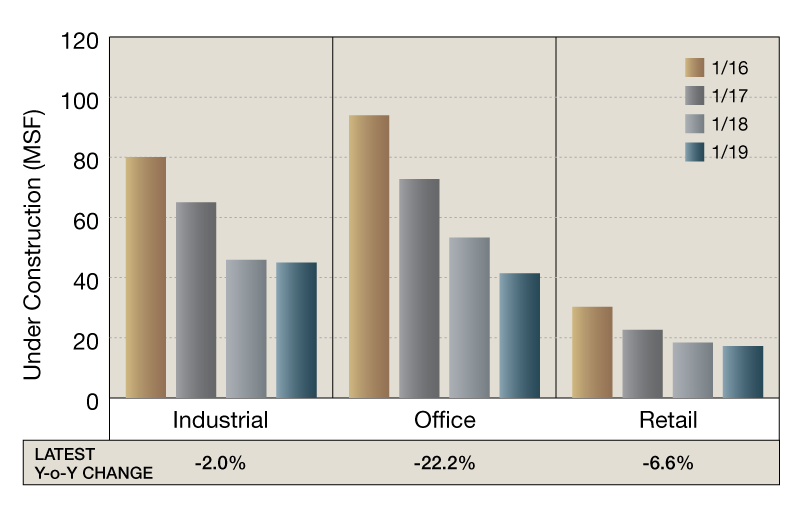
New development decreased for all property types year-over-year on a square foot basis. Office construction dropped by 22 percent, retail development fell by 7 percent and industrial followed with a 2 percent decline as of January. The percentage of office properties under construction decreased by only 20 basis points month-over-month, followed by retail assets (down by 1.9%). Development activity for industrial properties registered a 7.2 percent drop. Taking into account the past three years, the office sector peaked in January 2016 at some 94 million square feet underway. Development decreased by 22.6 percent compared to the same month in 2017. Comparing January 2016 to the same period in 2018, the office sector experienced a 43.3 percent drop, followed by a 55.9 percent decline in January 2019.
—Posted on Feb. 13, 2019



You must be logged in to post a comment.