2021 Net Lease Office Sales Volume and Cap Rates
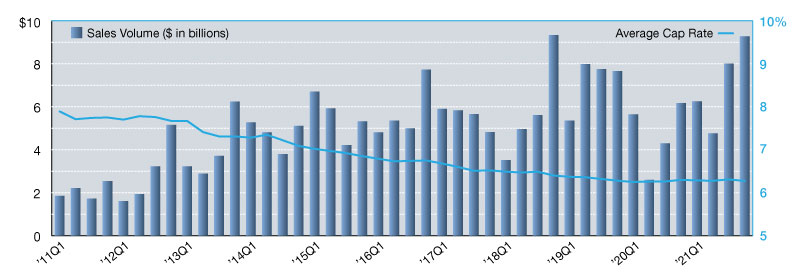
The single-tenant office sector reported a new quarterly record for investment sales volume during fourth quarter 2021, with nearly $9.3 billion in sales.
The single-tenant office sector reported a new quarterly record for investment sales volume during fourth quarter 2021, with nearly $9.3 billion in sales. This exceeded the previous high-water mark–set in fourth quarter 2018–by 3.5 percent, although full-year activity was not quite strong enough to set a new annual record. Still, with $28.3 billion in total sales for the year, future revisions may push totals even higher.
This momentum is great news for a sector still clouded in uncertainty. COVID-19 variants continue to impact return-to-office trends for traditional office space, although that doesn’t appear to be holding back investors anymore. The last six months have seen very strong levels of investment activity for single-tenant office driven by a mixture of single-asset and portfolio sales. Medical office buildings too are seeing increased competition from investors along with record-setting pricing.
Cap rates across the single-tenant office sector have seen very little movement in recent quarters. After reaching a low point of 6.2 percent in third quarter 2020, we’ve seen quarterly fluctuations that have taken average rates up to 10 basis points higher than the low. However, year-end 2021 reported the average single-tenant office cap rate at 6.3 percent–down four basis points quarter-to-quarter, but up the same amount year-over-year. The market is likely to see similar movement in 2022 as the sector regains traction with investors.
Lanie Beck joined Stan Johnson Co. in 2013. She oversees the firm’s corporate research efforts, publishing the quarterly MarketSnapshot report, the Viewpoint series of whitepapers and a variety of other thought leadership content. Beck is also responsible for leading Stan Johnson Co.’s corporate marketing, communications and public relations strategy, including the coordination of the firm’s social media presence, industry conference and event sponsorships, as well as management of the brand.
—Posted on Feb. 28, 2022
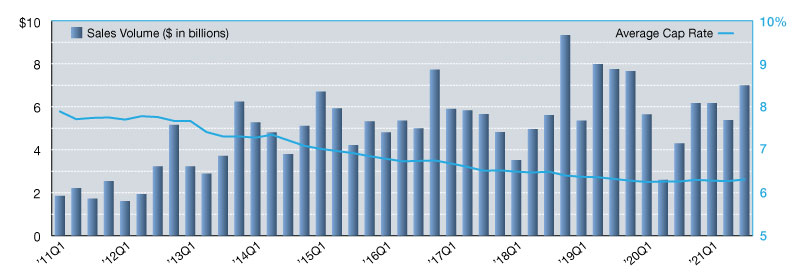
The single-tenant office market reported approximately $7.0 billion in investment sales during third quarter 2021. This marks a 30 percent quarterly increase in volume and puts year-to-date activity equal to the sector’s entire 2020 annual performance. A number of high-priced transactions contributed to the office market’s strongest quarter of sales activity since year-end 2019, making it the sixth strongest quarter on record.
Coast-to-coast, we saw corporate campuses trade hands, financial institution headquarters sales, insurance giants execute sale leasebacks and medical office buildings get acquired. As employees return to the office, available sublease space decreases, and new construction announcements are made, there’s a seemingly renewed confidence from investors across the office sector that’s translating to higher levels of activity in virtually every region of the U.S.
In the last several quarters, we’ve seen an uptick in average cap rates, with a 10-basis point year-over-year increase. In just third quarter 2021, average cap rates rose 4 basis points and ended the reporting period at 6.3 percent. While this trend may suggest further increases, investors should expect to see some fluctuation in the coming quarters, although substantial swings are not likely.
Lanie Beck joined Stan Johnson Co. in 2013. She oversees the firm’s corporate research efforts, publishing the quarterly MarketSnapshot report, the Viewpoint series of whitepapers and a variety of other thought leadership content. Beck is also responsible for leading Stan Johnson Co.’s corporate marketing, communications and public relations strategy, including the coordination of the firm’s social media presence, industry conference and event sponsorships, as well as management of the brand.
—Posted on Nov. 19, 2021
At the beginning of 2021, single-tenant net lease office market activity was driven by high-priced trades and portfolio sales. This resulted in a strong first quarter that matched year-end 2020 activity levels almost identically but across significantly fewer transactions. In second quarter 2021, the market saw a reversal in trends. The number of sales closed in the last three months were matched to first quarter’s count, but lower sale prices per transaction resulted in a 25 percent drop in dollar volume.
With only $4.6 billion in sales recorded in second quarter, it was a slower than average reporting period influenced by a drop in portfolio sales volume of more than 50 percent quarter-to-quarter. The market wasn’t without a few high-profile transactions though.
LinkedIn purchased its Sunnyvale, Calif., headquarters for $323 million, while Boeing executed a short-term sale leaseback for its campus in Bellevue, Wash., for $139 million. Medical office properties, data centers and call centers continue to trade as well, but traditional office buildings and corporate campuses are seeing renewed interest from investors which could impact future cap rate trends. The sector reported a four-basis point drop to 6.3 percent at mid-year, but average rates have fluctuated very little in recent quarters.
Lanie Beck joined Stan Johnson Co. in 2013. She oversees the firm’s corporate research efforts, publishing the quarterly MarketSnapshot report, the Viewpoint series of whitepapers and a variety of other thought leadership content. Beck is also responsible for leading Stan Johnson Co.’s corporate marketing, communications and public relations strategy, including the coordination of the firm’s social media presence, industry conference and event sponsorships, as well as management of the brand.
—Posted on Sep. 28, 2021
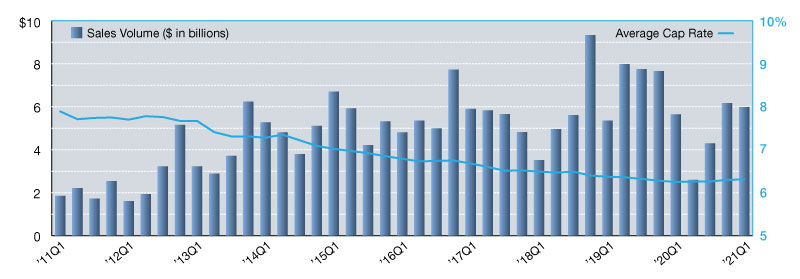
While the single-tenant retail and industrial sectors surprised the market in early 2021 with quarterly reductions in sales volume, the office sector told a different story. In a near-repeat performance of fourth quarter 2020, where $6.2 billion in sales were reported, the market posted just shy of $6.0 billion in sales volume over the past three months.
It should be noted, however, that the number of transactions quarter-to-quarter were not as closely aligned. In fact, the number of first quarter sales totaled only half as many as the previous quarter, illustrating a substantial increase in the sale price per transaction. Large portfolio sales, which increased 103 percent year-over-year, were a primary cause, contributing nearly half of first quarter’s sales volume.
Sale-leasebacks have been a huge driver of activity in recent quarters as well, and investors continue to seek out well-positioned medical office buildings too. Another trend investors will be watching closely is the return-to-office strategy for both large and small corporations.
As companies begin announcing plans, will a renewed commitment by occupiers translate to a jump in investor demand? If so, how will pricing be impacted? Currently, average cap rates for single-tenant office assets sit at 6.3 percent. Year-over-year, rates have increased only six basis points, but they could show additional movement in the coming quarters.
Lanie Beck joined Stan Johnson Co. in 2013. She oversees the firm’s corporate research efforts, publishing the quarterly MarketSnapshot report, the Viewpoint series of whitepapers and a variety of other thought leadership content. Beck is also responsible for leading Stan Johnson Co.’s corporate marketing, communications and public relations strategy, including the coordination of the firm’s social media presence, industry conference and event sponsorships, as well as management of the brand.
—Posted on Jul. 23, 2021


You must be logged in to post a comment.