Return-to-Office Plans Stall Again
Companies are reevaluating plans amid omicron-related uncertainty, the latest CommercialEdge office report suggests.
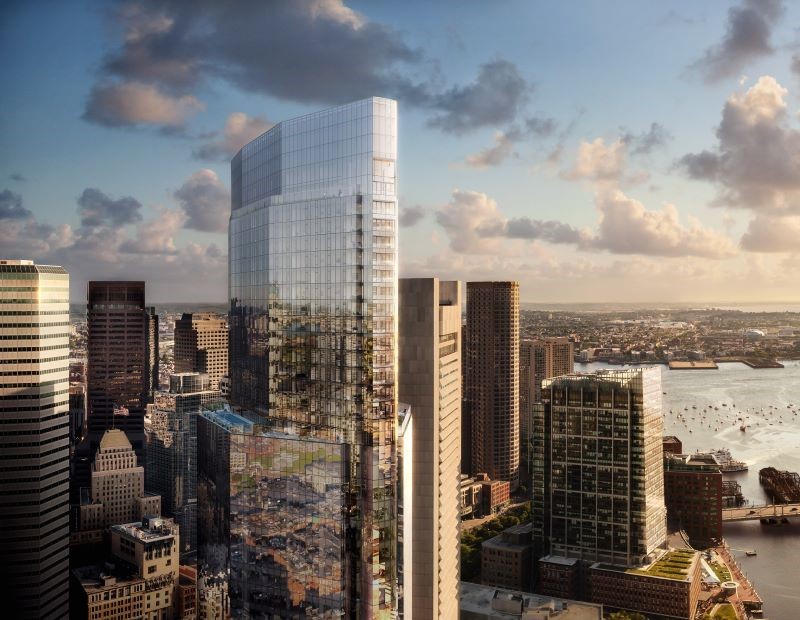
The national office vacancy rate clocked in at 15.5 percent in December 2021, 130 basis points higher on a year-over-year basis, despite plateauing in the second half of the year. National average full-service equivalent listing rates averaged $38.44 per square foot at the end of 2021, up 180 basis points year-over-year. The quality of space available—predominantly Class A—led to a significant uptick in office asking rates in Boston, clocking in at $38.37 per square foot in December 2021, an 11.6 percent increase year-over-year.
The emerging delta and omicron variants have once again halted return-to-the-office plans for most companies. Even Wall Street banks such as Citigroup, Bank of America and JPMorgan Chase—known to lean in toward having workers return to their offices—allowed employees to work from home until the third wave of the virus subsides, while Goldman Sachs tightened safety measures within the workplace. Meanwhile, large players such as Apple and Google parent company Alphabet readopted the wait-and-see approach. Case in point, office space utilization will look different than it did in February 2020, especially after CBRE’s Occupier Sentiment Survey revealed that 87 percent of office-using firms will adopt some form of a hybrid work program going forward.
The office-using sector added 51,000 new jobs in December 2021, up 3.6 percent year-over-year. Office-using employment continued its upward, yet uneven trajectory: There were 110,000 fewer office jobs in December 2021 than in February 2020. Only 32 of the 120 markets covered by CommercialEdge had more office-using employees than in February 2020. Meanwhile, Southern California markets lag the rest of the country in terms of employment recovery. Los Angeles has 7.5 percent fewer office-using jobs than its pre-pandemic total, followed by Inland Empire (5.4 percent).
Some 156.6 million square feet of office space was under construction across the nation at the end of December, with most of the active pipeline (69.7 percent) located in urban submarkets and Commercial Business Districts, while the rest is rising in suburban submarkets. The present share reflects pre-pandemic trends. Meanwhile, the planned portion of the pipeline indicates a shift in the development blueprint: At the beginning of 2020, 35 percent of the planned pipeline was in the suburbs, with the share jumping to 48 percent at the end of 2021.
Read the full CommercialEdge report.

You must be logged in to post a comment.