Labor/Economy
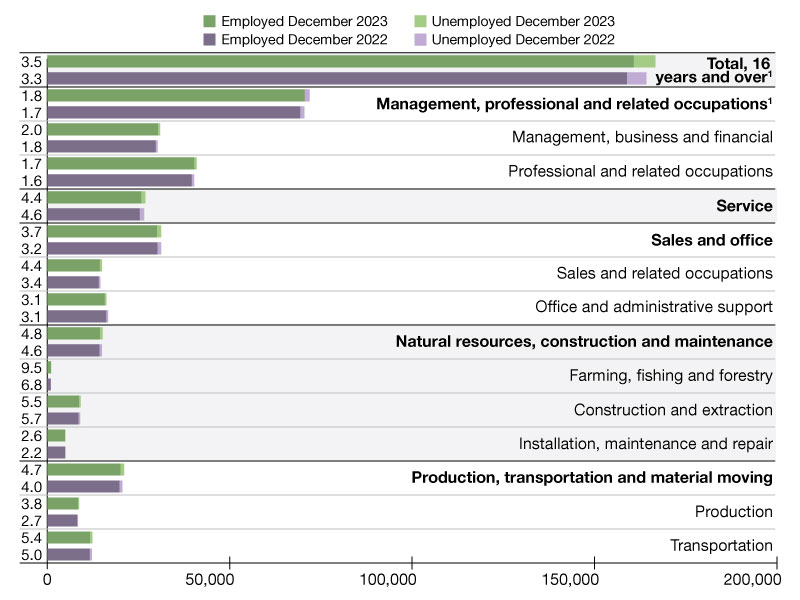
2023 Employment Picture
The latest year-over-year comparison, updated monthly.
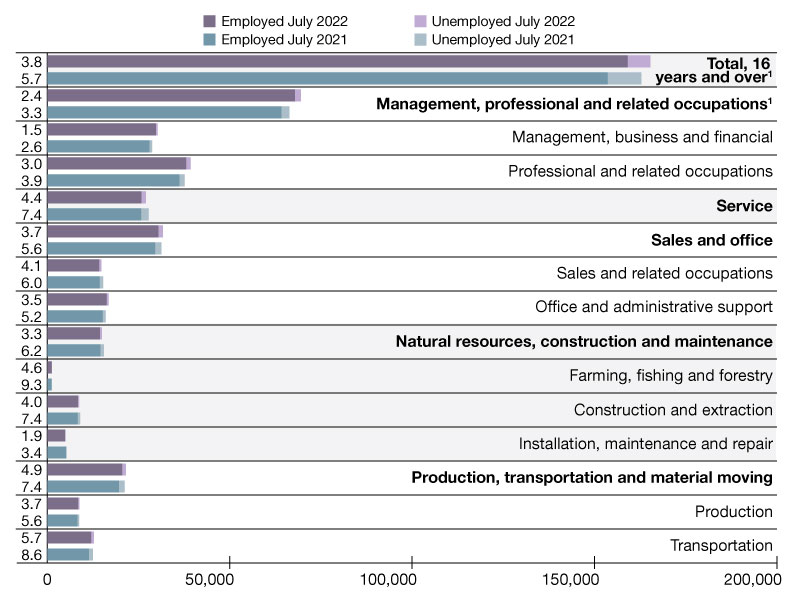
2022 Employment Picture
The latest year-over-year comparison, updated monthly.
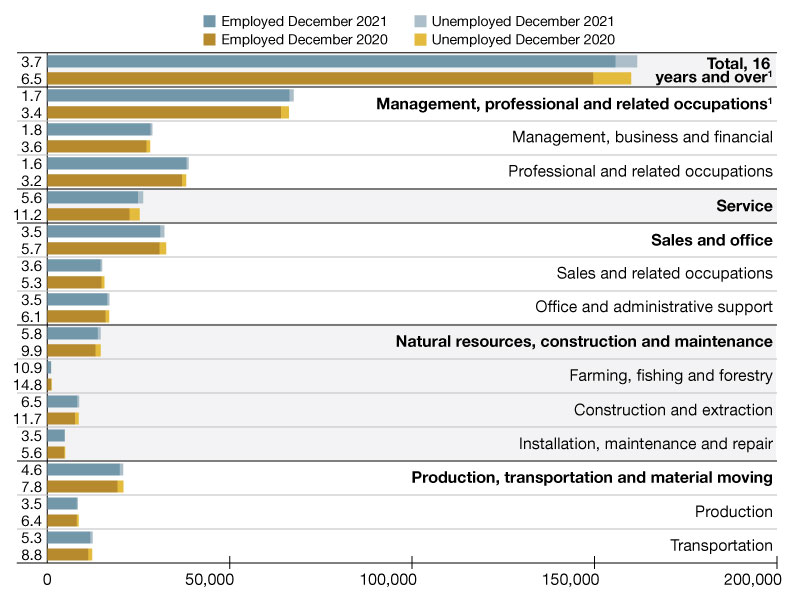
2021 Employment Picture
The latest year-over-year comparison, updated monthly.
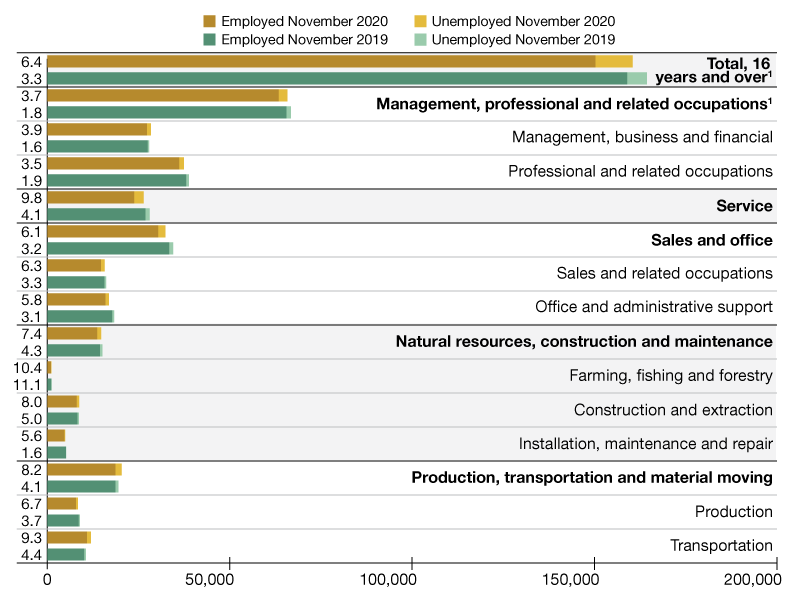
2020 Employment Picture
The latest year-over-year comparison of employed and unemployed persons by occupation, updated monthly.
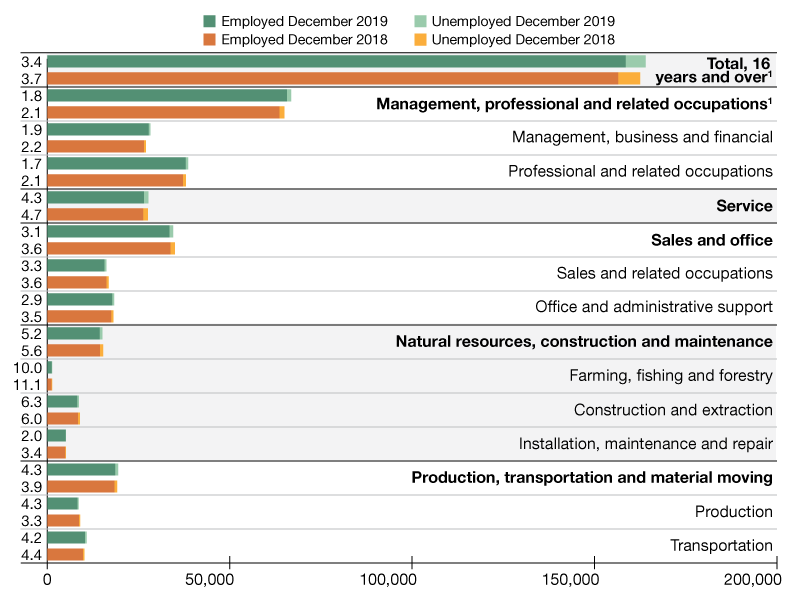
2019 Employment Picture
The latest year-over-year comparison of employed and unemployed persons by occupation, updated monthly.
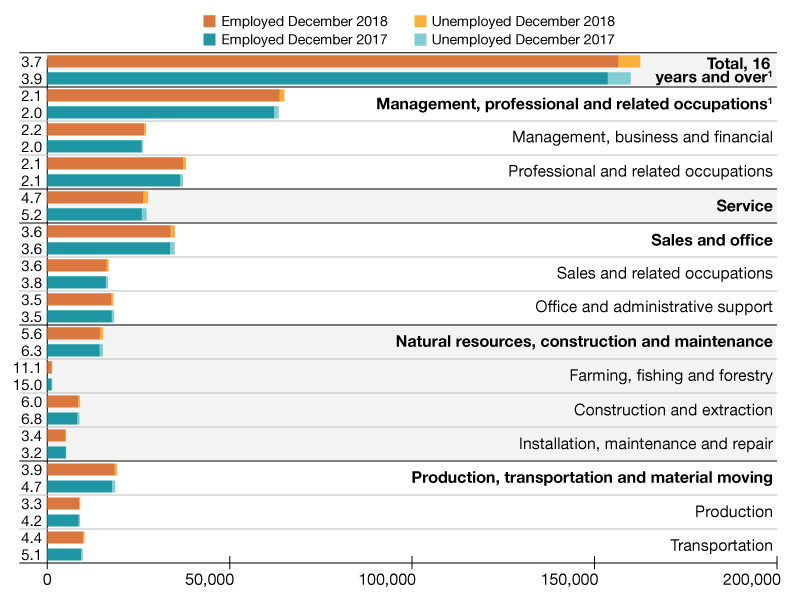
2018 Employment Picture
The latest year-over-year comparison of employed and unemployed persons by occupation, updated monthly.
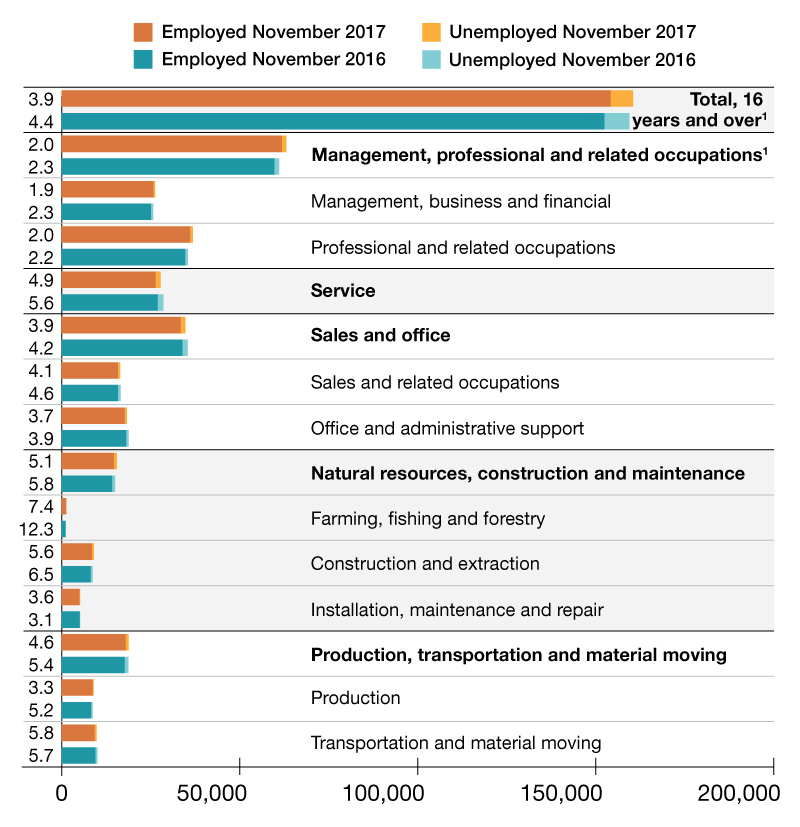
Employment Picture
Year-over-year, the largest change in employment was in the Farming, Fishing and Forestry occupations, which gained by 16.5 percent. Following that, the next increases were in Production (5.2 percent) and Construction and Extraction (5 percent).
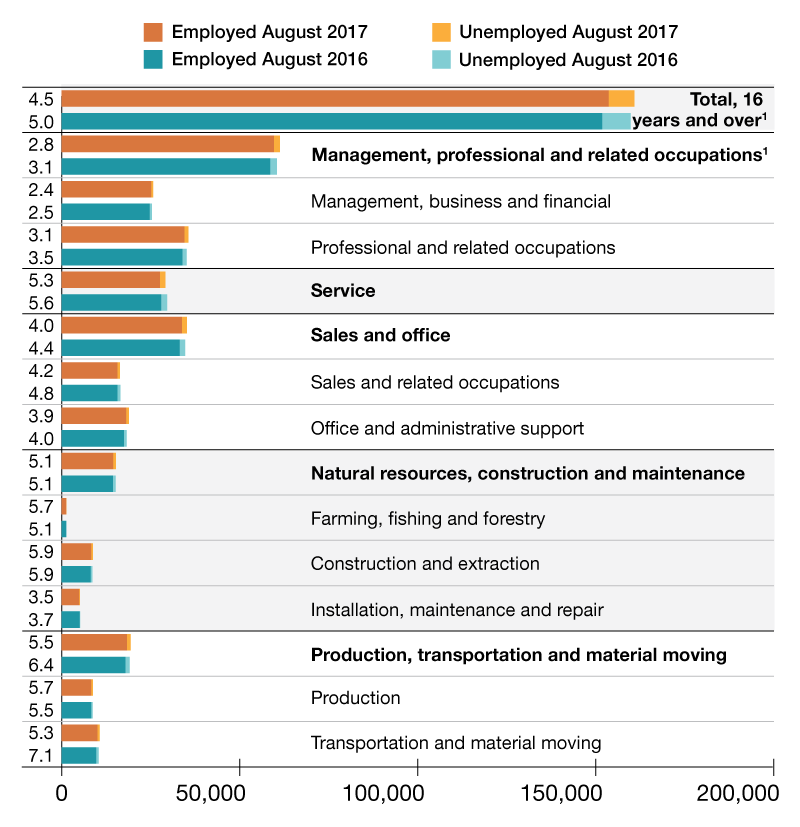
Employment Picture
The total number of employed people from August 2016 to August 2017 increased by 1.2 percent, or 1,772 people, while the total number of unemployed people decreased by 8.9 percent, or 709 people.
Employment Picture
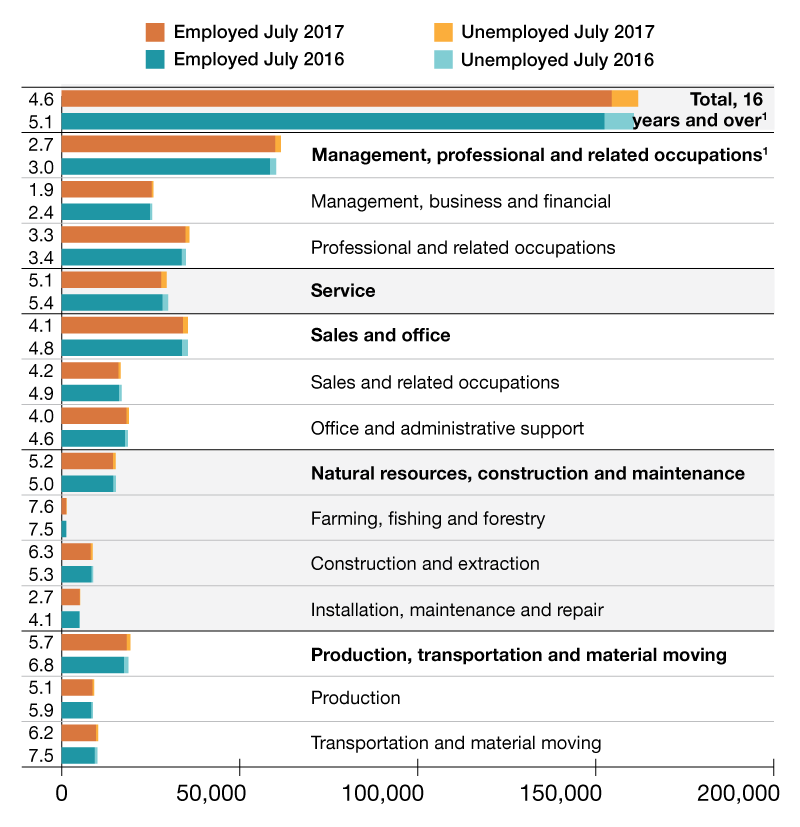
The total number employed from July 2016 to July 2017 increased by 1.3 percent, or 2,033 people, while the total number of unemployed decreased by 10 percent, or 826 people.

