Boston’s Office Pipeline Tops the US
The market has strong fundamentals across the board, according to CommercialEdge data.
Boston’s office sector has excelled in the first five months of the year, according to CommercialEdge information. The market led nationally for pipeline size and ranked second and third for completions and sales, respectively. In addition, the metro posted the lowest vacancy rate among top markets, clocking in at 12.1 percent as of May.
Boston’s office pipeline stood at more than 13.6 million square feet, accounting for 5.4 percent of total stock, more than four times the national average. During the same month, only 83.8 million square feet were under construction across the U.S.
Boston’s office pipeline outperformed across metrics
As of May, Boston’s office pipeline led the nation, with more than 13.6 million square feet under construction—5.4 percent of total stock, way above the 1.2 percent national average. The metro was followed by Austin (4.7 percent) and San Diego (4.2 percent) and San Francisco (3.2 percent).

Additionally, three properties broke ground in the first five months of the year, which are expected to total around 676,350 square feet. This represents almost 6.4 percent out of all the projects that started construction during the same period across the U.S.
When factoring in projects in planning stages, Boston’s office pipeline stood at 11.6 percent of stock, almost triple the national average. Markets such as Austin (15.2 percent) and Dallas (12.2 percent) surpassed Boston, while Seattle (7.7 percent) and Washington, D.C. (4.0 percent), were far behind.
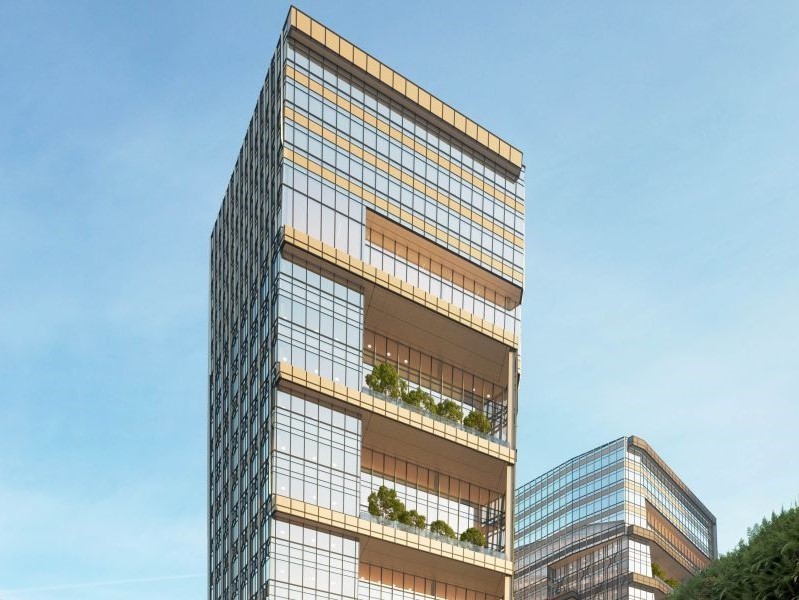
BioMed Realty is one of the most active developers in the market. One of its projects, 585 Kendall, rises in Cambridge, Mass., and will comprise 600,000 square feet of office and life science space. Construction started in 2022 and is scheduled for completion in 2026. The 16-story development is already fully preleased to Takeda Pharmaceutical Co.
More properties to come online
Eight office properties came online year-to-date as of May totaling 1.8 million square feet—0.6 percent of total inventory. This represented a 5.1 percent year-over-year increase in deliveries, in a time when national completions dropped by 20.4 percent.
Seattle (2.5 million square feet) was the only metro with more space coming online than Boston, while Philadelphia (647,303 square feet), the Bay Area (308,543 square feet) and Los Angeles (303,175 square feet) were at the opposite end of the spectrum. Boston’s office pipeline will continue to prop up development as deliveries continue.
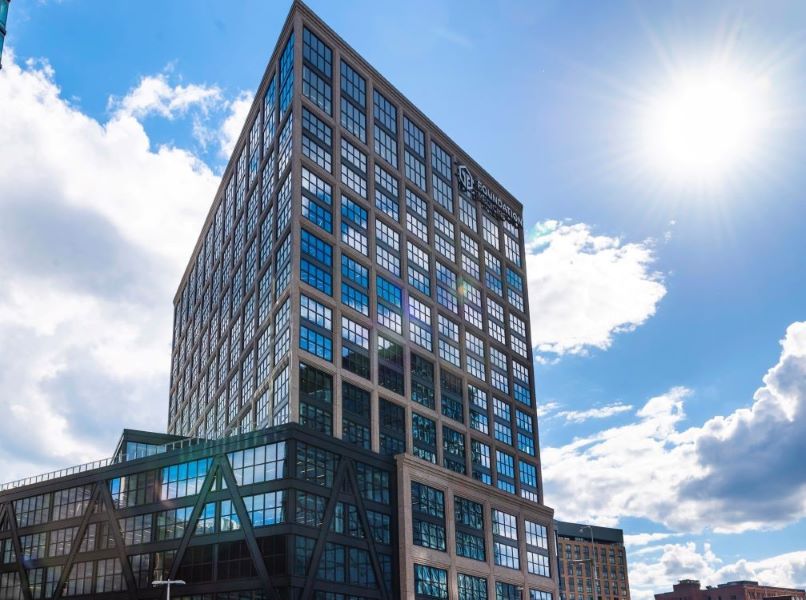
In May, WS Development completed One Boston Wharf, a 707,000-square-foot life science building in the Seaport Innovation District. The LEED Platinum-certified property is fully leased to Foundation, a subsidiary of pharmaceutical company Roche.
At the beginning of the year, a partnership between Celera Properties and True North Management Group completed the first phase of the 250,000-square-foot Andover Technology Park in Andover, Mass. The life science and innovation project involves the redevelopment of two buildings that came online in 1996 and 1998. The second and final phase is already underway and is expected to be delivered in the following months.
Strong transaction activity bucks trend
Boston ranked third nationally for sales, with $761 million registered year-to-date as of May. Washington, D.C., took the lead with almost $1 billion, followed by the Bay Area ($795 million).
Office assets in the metro traded for $262 per square foot on average, a considerably higher price than the $165 national figure. Austin commanded the highest sales figure ($433), followed by San Diego ($422) and Los Angeles ($368), while Philadelphia ($90) and New Jersey ($112) were at the opposite pole.
In March, BXP sold a 45 percent interest in 290 Binney St., a 570,000-square foot life science development in Kendall Square in Cambridge’s Kendall Square. Norges Bank Investment Management was the buyer. According to their statement, the transaction will reduce BXP’s share of the project’s estimated development cost over time by some $533.5 million.
The building is scheduled to come online in 2026 and is fully preleased to AstraZeneca.
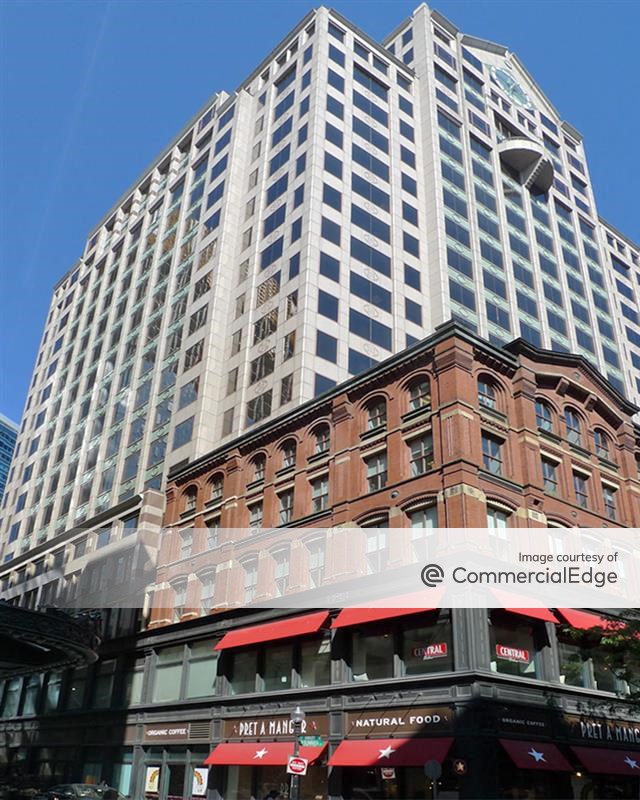
The same month, Synergy Investments acquired the almost 474,000-square-foot 101 Arch St., an office building in Boston’s downtown. Clarion Partners sold the asset for $78 million—or $164.59 per square foot.
Lowest vacancy rate among top markets
Benefitting from the development of high-quality life science properties, Boston’s vacancy rate as of May stood at 12.1 percent, well below the 17.8 percent national average. Even though this marked a 180-basis-point increase year-over-year, the metro fared better than peer markets such as Dallas (450 bps increase), Seattle (350 bps increase) and San Diego (310 bps increase).
Furthermore, Boston had the lowest vacancy rate among gateway markets, whereas San Francisco (25.2 percent) experienced the highest one.

Last month, Persimmon Technologies, a subsidiary of Sumitomo Heavy Industries, committed to 142,224 square feet at W. P. Carey’s building in Bedford, Mass. The property at 35 Crosby Drive is currently being redeveloped into a 160,000-square-foot R&D facility. Completion is expected later this year.
In March, Takeda Pharmaceutical Co. signed a 10-year lease extension at Alexandria Real Estate Equities Inc.’s 75/125 Binney St. The firm will continue to occupy 222,925 square feet within the 339,082-square-foot life science property.
The average listing rate in the metro as of May stood at $46.71, a 12.1 percent increase over the year. The national average was $37.72, after a 170-basis-point drop from the same period in 2023.
Boston’s coworking sector remains steady
Boston’s coworking sector comprised a little less than 4.6 million square feet as of May. The metro surpassed Miami (2.9 million square feet) and San Francisco (3.2 million square feet), but lagged behind Washington, D.C. (6 million square feet), and Chicago (6.3 million square feet). Manhattan led nationally, with 11.5 million square feet.
The metro’s shared space volume accounted for 1.7 percent of all leasable office space, slightly below the 1.8 percent national average. Among peer markets, Miami had the largest proportion of shared space out of total stock, clocking in at 3.7 percent.



You must be logged in to post a comment.