Office Vacancy Rates On The Rise
An update on how the year-over-year change in vacancy evolved in the top 25 U.S. markets, according to CommercialEdge data.
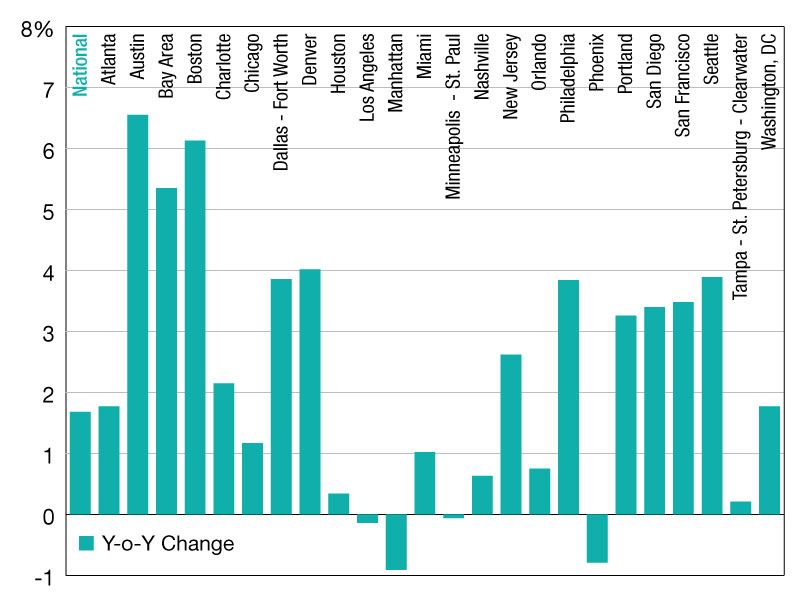
As of September, office utilization remained unchanged and vacancy rates are continued to rise, marking a 1.7 percent year-over-year change on a national level. That month, the national vacancy rate stood at 19.5 percent.
Among the top markets in the U.S. where the office vacancy rate showed a big increase in comparison with last year’s data stands Austin—leading with a 6.6 percent year-over-year change—followed by Boston (6.1 percent), Denver (4.0 percent) and Seattle (3.9 percent).
On the other hand, office markets that showed improvements in vacancy rates include Manhattan, that marked a 0.9 percent year-over-year drop, and Phoenix, showing a 0.8 percent decrease. These two metros showed a 16.8 percent and a 18.0 percent vacancy rate in September, respectively, below the national rate. Los Angeles is also showing a slight improvement, with a 0.1 percent year-over-year decrease, with its vacancy rate reaching 16.3 percent as of September.



You must be logged in to post a comment.