Boost in US Manufacturing Spurs Construction Boom
New developments surged to more than 400 million square feet, according to the latest CommercialEdge report.
The push to enhance U.S. manufacturing, especially for semiconductors and clean energy technology, has spurred a construction boom, the latest CommercialEdge industrial report notes.
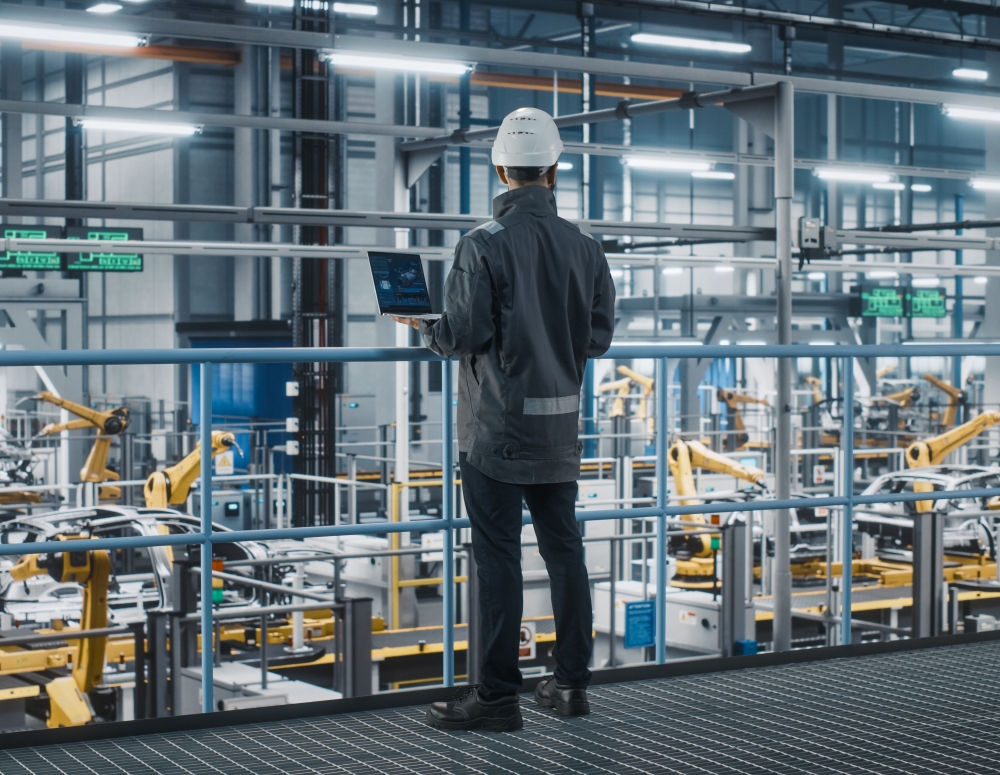
This boom is driven by manufacturers aiming to strengthen supply chains and reduce outsourcing, supported by two key laws. The CHIPS and Science Act offers tax credits for domestic semiconductor production, while the Inflation Reduction Act funds and incentivizes U.S.-made clean energy technology. Manufacturing construction spending reached $233 billion in April 2024, more than doubling in two years, according to the U.S. Census Bureau. CommercialEdge data shows manufacturing comprises more than 30 percent of industrial space underway (124.8 million square feet).
Despite the construction surge, job growth in manufacturing has not followed. Employment has been stagnant for 18 months, only 1.4 percent higher than in February 2020. This is partly due to long facility delivery times.
While manufacturing will drive industrial real estate activity, its full impact will take years to materialize. The tariffs will increase consumer prices but benefit the industrial sector. Once projects are completed, manufacturing employment is expected to rise, and additional firms will emerge.
READ ALSO: How Will the Manufacturing Investment Boom Impact Industrial CRE?
The national under-construction pipeline included 401.6 million square feet of industrial space at the end of April, accounting for 2.0 percent of total stock, CommercialEdge data shows. New industrial projects are starting at a slower pace in 2024, with only 49.2 million square feet initiated through April.
The largest pipelines on a percentage of stock basis were in Phoenix (10.8 percent, 41.8 million square feet underway), Kansas City, Mo. (4.6 percent, 13.3 million square feet), Memphis, Tenn. (3.4 percent, 10 million square feet), Charlotte, N.C. (3.3 percent, 10.5 million square feet) and Denver (2.9 percent, 7.7 million square feet). Meanwhile, industrial sales year-to-date as of April totaled $15 billion, with properties trading at an average of $146 per square foot.
Industrial vacancy at normalized level
After spending a month in second place, the Inland Empire regained the top spot for in-place rent growth, with rates rising 12.5 percent over the past 12 months. Miami ranked second, with rents up 12.0 percent, followed by Los Angeles (11.2 percent), Orange County (9.4 percent) and New Jersey (8.9 percent).
At the same time, rent growth was lowest in Detroit, at 3.0 percent over the past 12 months, followed by St. Louis (3.5 percent), Kansas City. Mo. (3.6 percent) and Denver (4.1 percent).
National industrial vacancy stood at 5.2 percent in April, unchanged from the previous month. Over the past year, industrial vacancies have largely returned to normal levels, following a period of exceptional tightness since the pandemic. Vacancy was lowest in Columbus (2.7 percent), Kansas City, Mo. (3.0 percent), Nashville, Tenn. (3.6 percent) and Charlotte (3.8 percent).
Read the full CommercialEdge report.



You must be logged in to post a comment.