Boston Office Vacancy Up, Deliveries Higher
The market leads the nation for projects underway and completions, according to the latest CommercialEdge data.
Boston’s office sector remained in the spotlight, leading nationally in terms of development pipeline and completions. However, with more properties coming online, the market’s vacancy rate saw a 650-basis-point increase year-over-year, clocking in at 16.8 percent, CommercialEdge data shows. The figure is still well below the 19.4 percent national average.
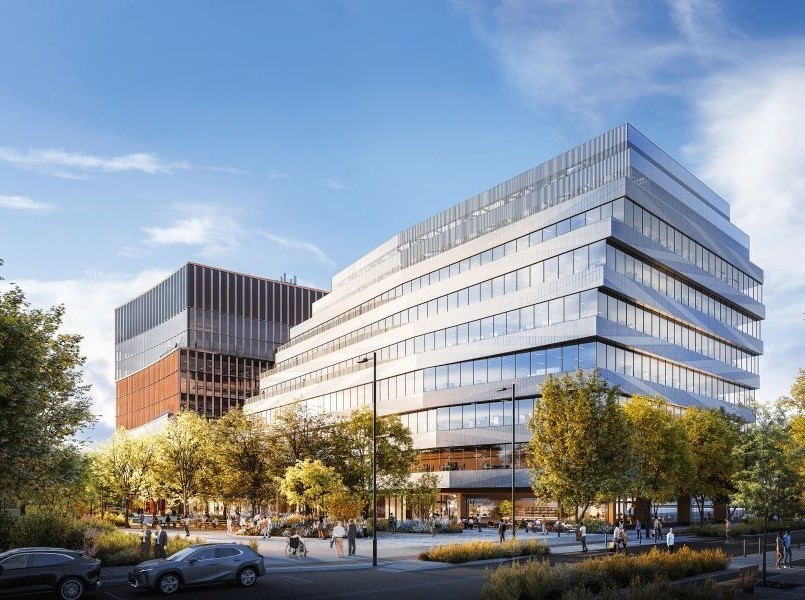
Life sciences assets continue to be among the most sought-after projects for developers in the area, driven by increasing demand for cutting-edge research facilities and innovation hubs. The subsector accounted for 8.6 million square feet of the 10.8 million square feet of office space under construction.
Boston’s investment volume is also holding steady, with total sales amounting to $1.1 billion. Additionally, the city remained one of the most expensive office markets nationwide in terms of rents, averaging $53.35 per square foot, a 17.0 percent growth year-over-year.
Office developments continue to reshape the city’s skyline
Boston’s office under-construction pipeline at the end of October stood at almost 10.8 million square feet, continuing to lead nationally, based on CommercialEdge data. This accounts for 4.3 percent of its existing inventory, almost five times larger than the 0.9 percent national rate. San Francisco (3.8 million square feet), Austin (3.5 million square feet) and San Diego (3.1 million square feet) trailed behind the metro.
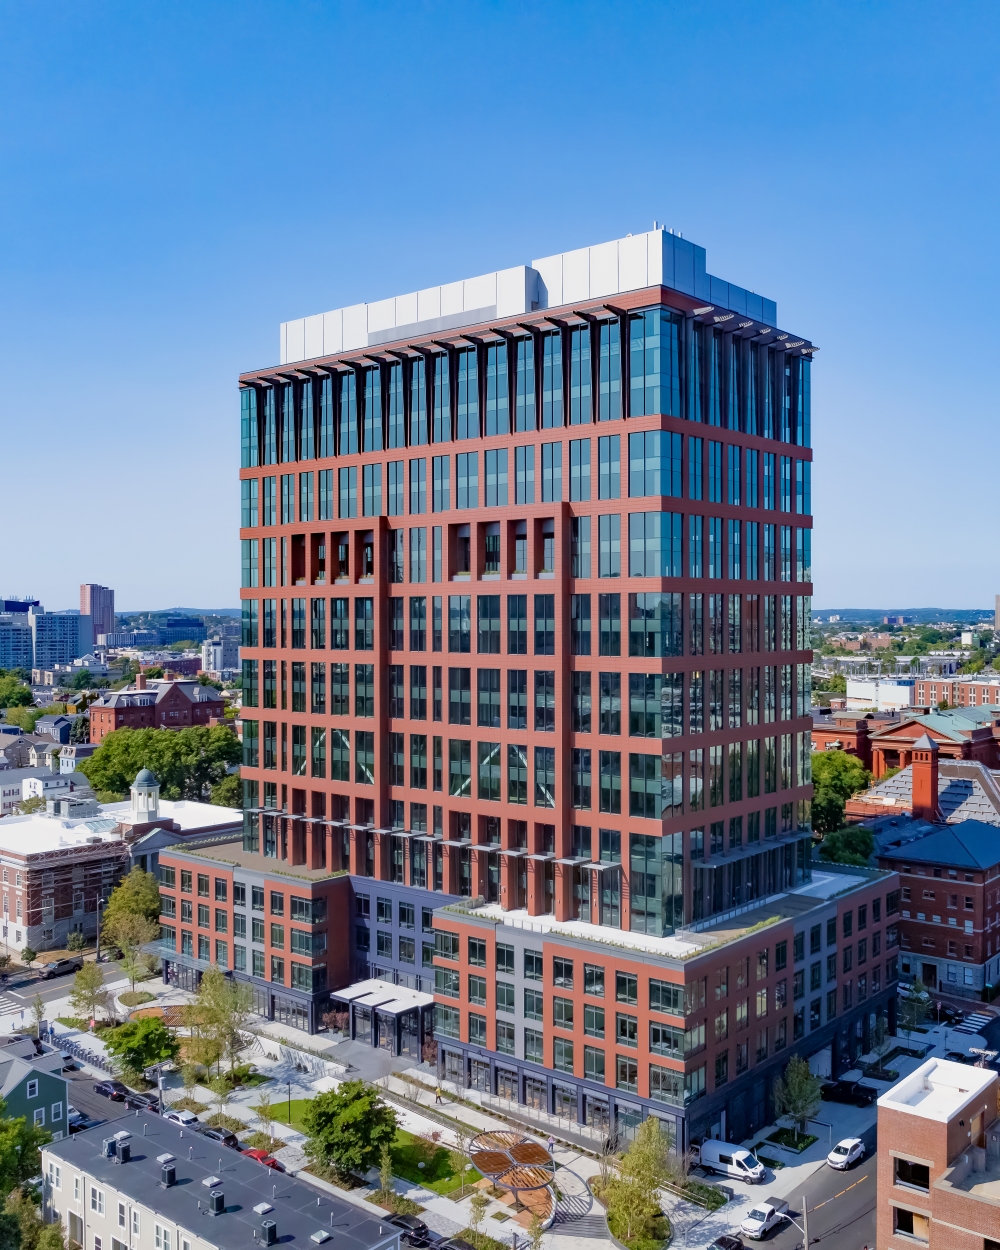
Earlier this summer, Tishman Speyer topped out the first phase of its Harvard Enterprise Research Campus in Allston, Mass. The 440,000-square-foot lab component broke ground last November and is a collaboration of the company with Harvard University and The Harvard Allston Land Co. The master plan is one of the biggest construction projects in Boston and is expected to total about 900,000 square feet of residential, office and retail space.
In terms of completions, the metro saw 5.7 million square feet coming online as of October. The 19 delivered properties account for 1.9 percent of Boston’s inventory, considerably above the 0.6 percent national figure. It also marks an 11.4 percent year-over-year improvement.
Among gateway markets, Boston ranked first in terms of completions as well. Chicago (4.8 million square feet), Seattle (3.9 million square feet) and Manhattan (3.1 million square feet) also ranked high nationwide, while Miami (1.1 million square feet) and Washington, D.C. (1.9 million square feet) saw less space coming online.
In October, a joint venture of CBRE Investment Management, Leggat McCall Properties and Granite Properties completed the conversion of 40 Thorndike, a 475,000-square-foot mixed-use building in Cambridge, Mass. The property, previously a courthouse and jail from the 1940s, includes 422,000 square feet of office space and 48 affordable units.
Government agencies grant more funds for conversions
This year, CommercialEdge has developed the Conversion Feasibility Index, a Yardi-powered tool meant to assess an office property’s suitability to multifamily conversion. As the office-to-residential adaptive reuse topic continues to gain momentum, the CFI provides valuable insights for investors.
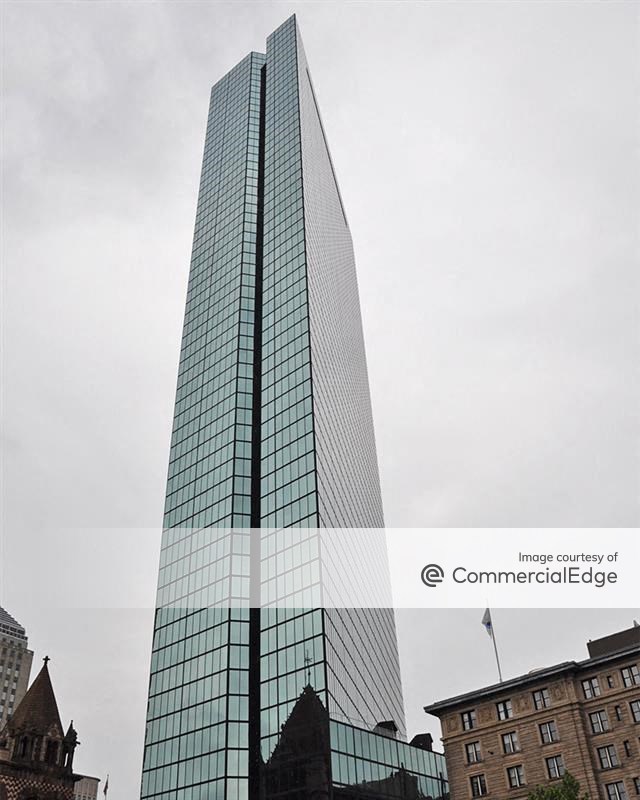
State and national agencies are also actively supporting this trend. Recently, the City of Boston announced the extension and additional funding for its Office to Residential Conversion Program. The state is contributing $15 million to encourage the adaptive reuse of larger office buildings into housing.
One of the projects that received approvals from the Boston Planning & Development Agency earlier this year is 85 Devonshire St., which involves the conversion of three adjacent office buildings into one community totaling 95 residential apartments. KS Partners is developing the project, which is set to also include 19 affordable units and retail space, CommercialEdge data shows. The property’s CFI score stands at 79, meaning that while a solid candidate for conversion, some roadblocks will be present in the process. .
Metro Boston is one of the top markets suitable for office adaptive reuse. About 5.9 million square feet of its office space has strong potential for conversion, accounting for 1.9 percent of the city’s total stock.
Boston pricey deals remain extant
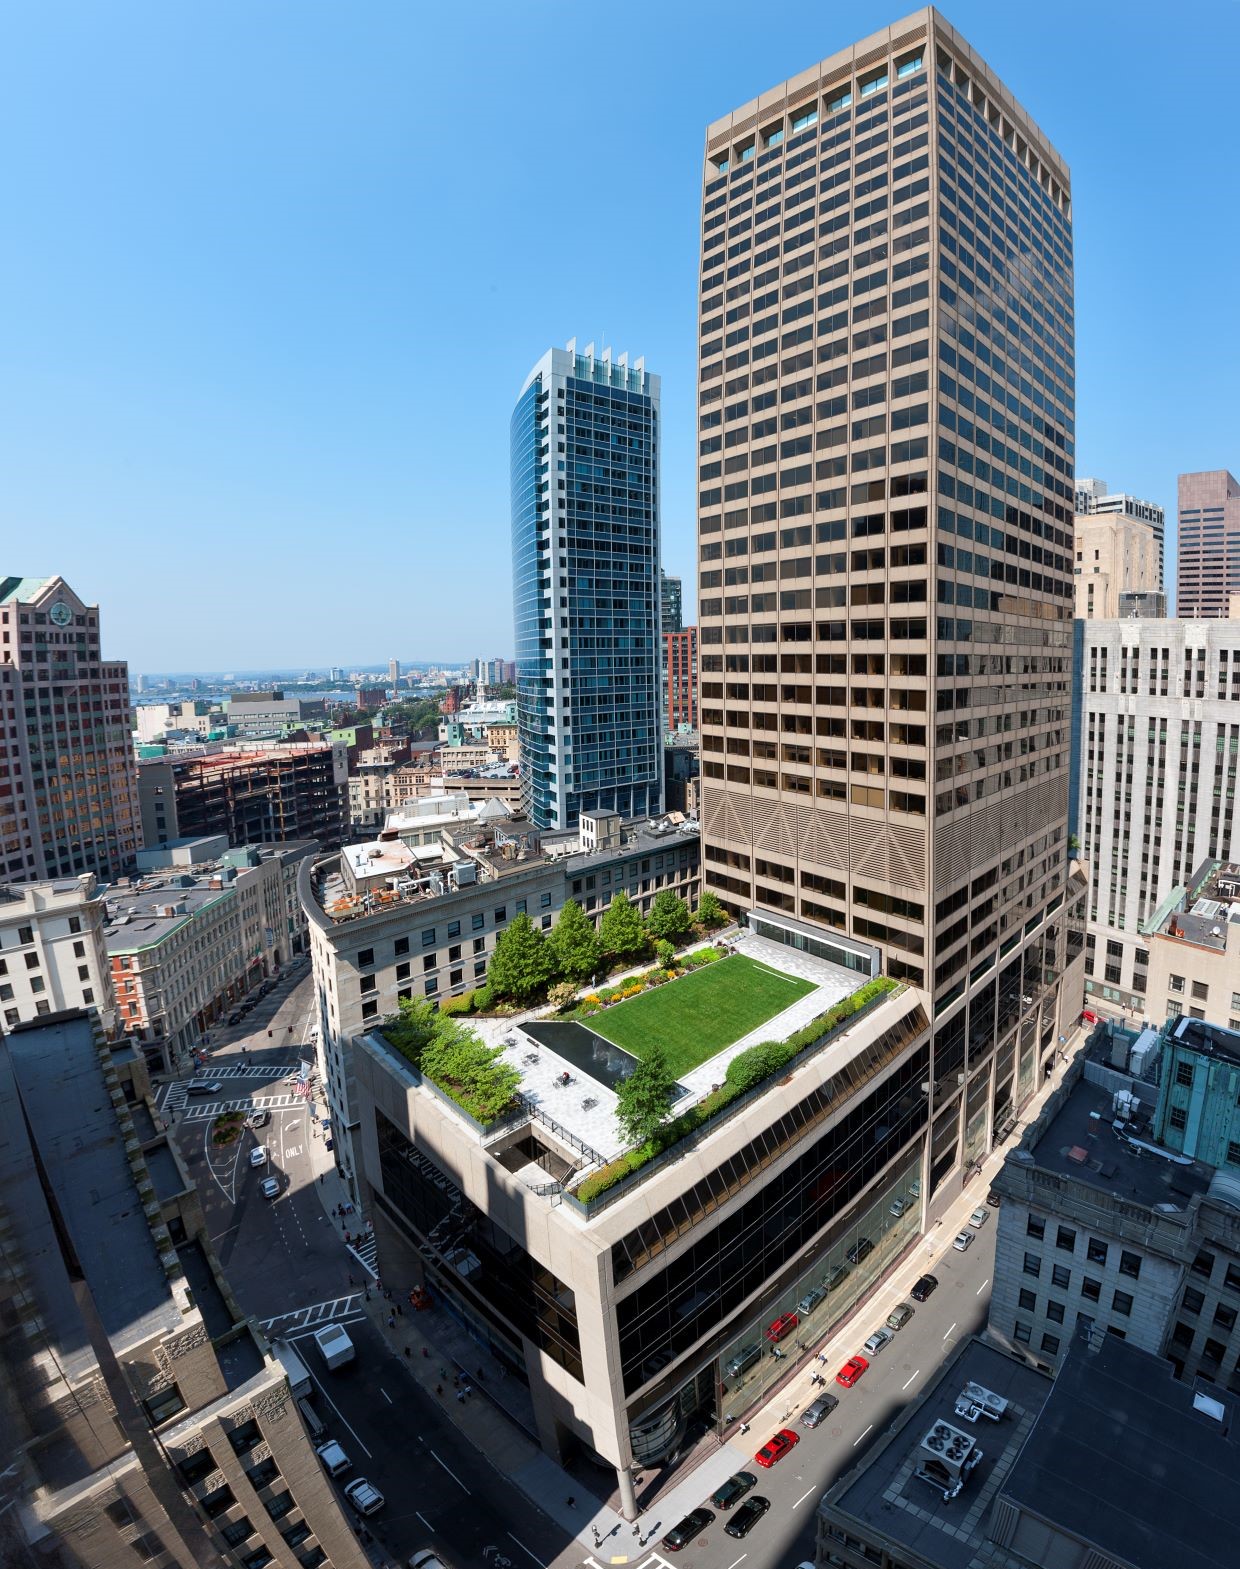
Sales in the metro in the first 10 months of the year accounted for $1.1 billion. Boston’s office assets traded for $187 per square foot on average, slightly above the $177 national average.
The market ranked sixth nationally in terms of office investment volume. Manhattan ($3.3 billion) remained in the spotlight, followed by Washington, D.C. ($2.5 billion). San Francisco ($722 million) and Seattle ($668 million) were some of the gateway metros that were at the opposite end of the spectrum.
In one of the most expensive deals per square foot, Azora Group acquired 149 Newbury Street, a 45,495-square-foot office and retail building for $101 million. The mixed-used asset came online last year and traded for about $2,220 per square foot.
Vacancy rate rises sharply, still below the national average
Boston’s office vacancy rate at the end of October clocked in at 16.8 percent, 650 basis points higher year-over-year, the second-highest increase among the top markets. Despite the worrisome increase in vacant space, the metro’s metrics were below the 19.4 national average and large leasing deals still happened.
For example, back in August Bain Capital signed a 378,000-square-foot lease renewal and expansion at BXP’s 200 Clarendon St., a 1.7 million-square-foot office tower in Boston. The company initially signed a 208,000-square-foot, 15-year agreement at the building in 2010.
Additionally, Commonwealth of Massachusetts’ Division of Capital Asset Management and Maintenance signed a 106,000-square-foot leasing agreement at Tishman Speyer’s One Federal Street. Six government agencies are expected to occupy two full floors at the more than 1.1 million-square-foot building for at least 10 years.
The metro also fared better than most of the other gateway markets, except for Manhattan (16.7 percent), Miami (14.4 percent) and Los Angeles (15.7 percent). However, San Francisco (27.7 percent) and Seattle (25.8 percent) had more space left vacant.
Boston coworking’s space trails behind gateway markets
Boston’s office sector comprised more than 4.8 million square feet of shared office space across 207 properties. This represents 1.8 percent of the metro’s total inventory. Among gateway markets, only Washington, D.C. (1.7 percent) had a lower share of coworking space, while Miami (3.8 percent), Manhattan (2.2 percent) and San Francisco (2.1 percent) were at the opposite end.
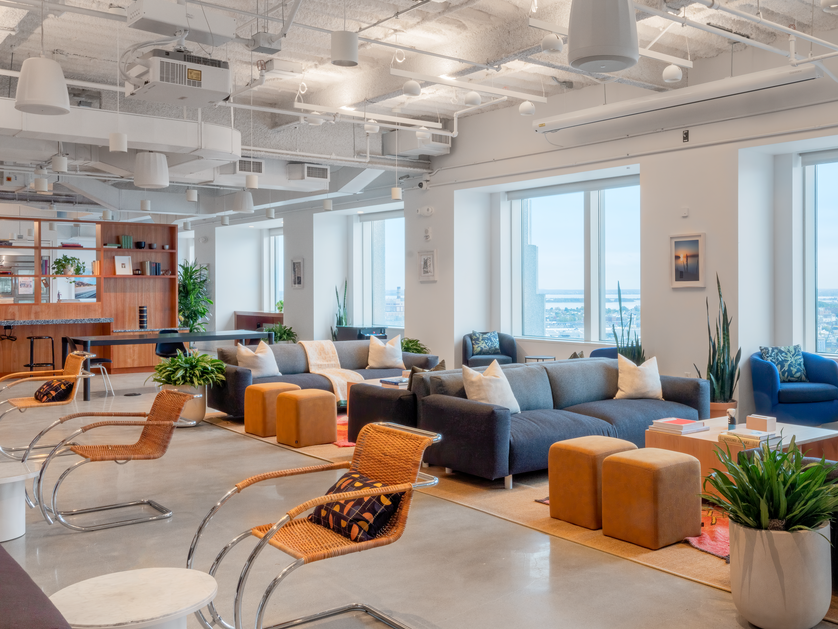
Additionally, the metro saw a $24 increase in the average monthly rate as of the third quarter of this year, reaching $399 per month, according to CoworkingCafe. The national average during the same time was $300.
Regus was the company with the largest shared space inventory in the market as of October, owning 588,565 square feet across 32 locations. The firm was followed by WeWork (448,716 square feet) and Industrious (223,830 square feet).
Earlier this month, WeWork entered into a revenue-sharing agreement under which it will continue to operate on a three-floor coworking space in Boston. The 64,323-square-foot space is within Fortis Property Group’s State Street Financial Center, a 1.1 million-square-foot, 36-story tower.



You must be logged in to post a comment.