Research Center
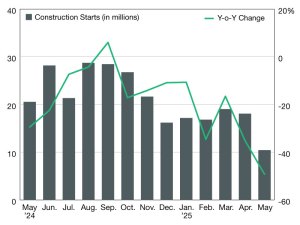
Industrial Construction Starts Plunge in 2025
Groundbreakings declined sharply this year, compared to the same period in 2024, according to CommercialEdge data.
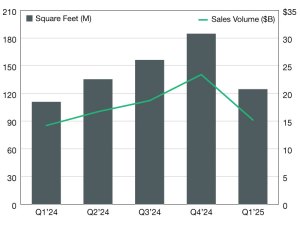
2025 Industrial Sales Update
Industrial deals totaled more than $70 billion in 2024, CommercialEdge data shows.
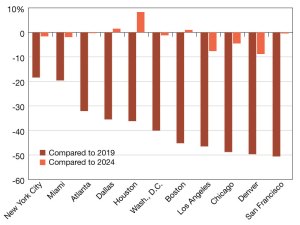
2025 Placer.ai Office Index
See the evolution of office foot traffic patterns on a nationwide and regional level.

2025 Commercial REIT Values
S&P Global Intelligence’s latest snapshot of REIT performance. Read the report.
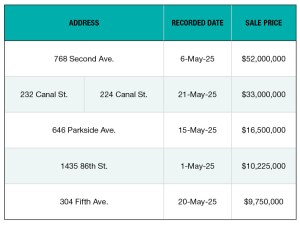
Top 5 NYC Retail Building Sales—May 2025
The metro’s top deals for the sector rounded up by PropertyShark.
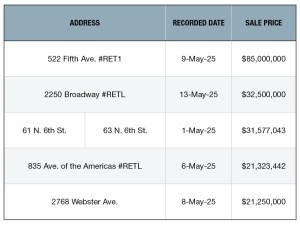
Top 5 NYC Office Building Sales—May 2025
The metro’s top deals for the sector rounded up by PropertyShark.

Office Report: Vacancies Drive Conversion Boom
High vacancies have sparked 149 million square feet in proposed office conversions, according to the latest Yardi Matrix report.
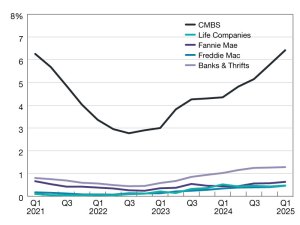
Commercial and Multifamily Mortgage Delinquency Rates Increased in Q1 2025
The uptick in CMBS delinquencies signals stress in some market areas, according to MBA research.
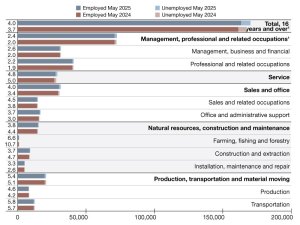
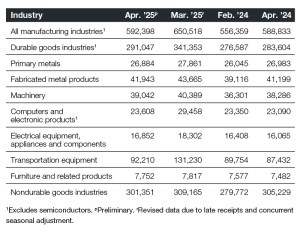
2025 Employment Picture
The latest year-over-year comparison by the Bureau of Labor Statistics, updated monthly.