Investment (Research Center)
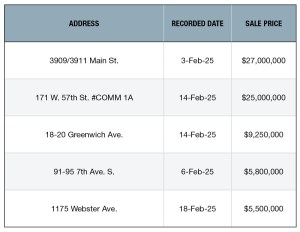
Top 5 NYC Retail Building Sales—February 2025
A recap of recent major transactions compiled by PropertyShark.
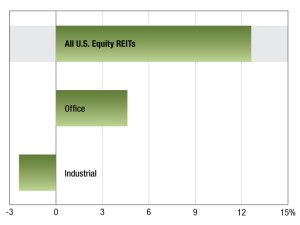
2025 REIT Returns
The Dow Jones Equity All REIT Index’s latest update on performance from S&P Global Market Intelligence.
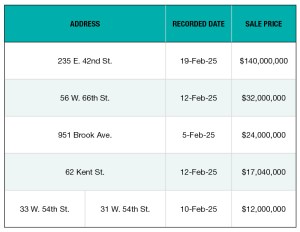
Top 5 NYC Office Building Sales—February 2025
A recap of recent major transactions compiled by PropertyShark.
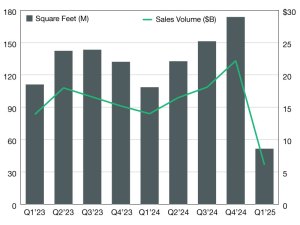
Industrial Sales Volume Increased Through 2024
Industrial deals totaled more than $70 billion in 2024, CommercialEdge data shows.
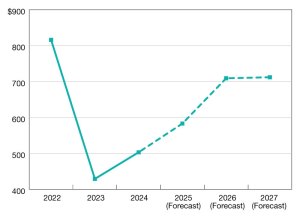
Lending Expected to Reach $583B in 2025
The Mortgage Bankers Association forecasts a 16 percent year-over-year increase.
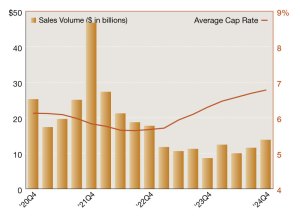
2024 Net Lease Sales Volume and Cap Rates
Top trends impacting the market according to Northmarq.

2025 REIT Trading Trends
The Dow Jones Equity All REIT Index’s latest update on performance from S&P Global Market Intelligence. Read the report.

Top 5 NYC Retail Building Sales—January 2025
The metro’s top deals for the sector rounded up by PropertyShark.

Top 5 NYC Office Building Sales—January 2025
The metro’s top deals for the sector rounded up by PropertyShark.
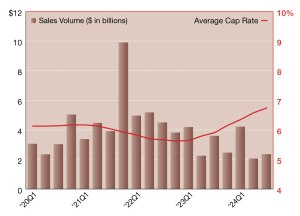
2024 Single-Tenant Retail Quarterly Sales Volume & Cap Rates
Northmarq’s update on the sector’s investment activity.