Economy Watch: Construction Spending Up in 2017
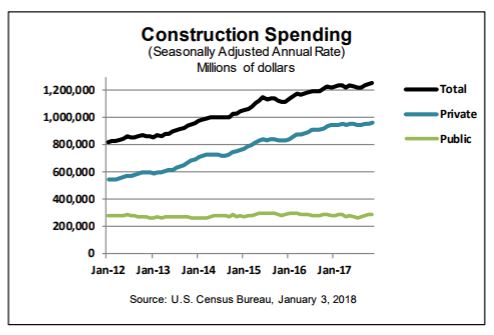
During the first 11 months of 2017, construction spending nationwide amounted to $1.14 trillion, 4.2 percent more than for the same period in 2016, the U.S. Census Bureau reported.
By D.C. Stribling, Contributing Editor
U.S. construction spending during November 2017 came in at an annualized rate of $1.26 trillion, or 0.8 percent above the revised October figure, according to a U.S. Census Bureau report released Jan. 3. The November figure is also 2.4 percent above the November 2016 total of $1.23 trillion. During the first 11 months of 2017, construction spending nationwide amounted to $1.14 trillion, 4.2 percent more than for the same period in 2016.
Both private and public spending for construction projects increased. Spending on private construction in November was 1 percent above the revised October total, and 2.6 percent higher than a year earlier. Spending on public construction projects was up 0.2 percent for the month and 1.8 percent for the year.
Spending on private single-family residential projects gained 1.9 percent for the month and a strong 8.9 percent for the year. The picture was pretty much the opposite for multifamily construction spending, which was down 1.3 percent for the month, but also down 1.7 percent for the year.
In the non-residential sector, spending on office projects, while up 5.5 percent for month, dropped 6.9 percent for the year. By contrast, the Census Bureau category “commercial” (which includes industrial development) was up 1.2 percent for the month and a robust 8.2 percent for the year. Health care likewise had a strong year-over-year increase, up 8.8 percent. Spending on hotel projects eked out a 0.6 percent gain for the year.


You must be logged in to post a comment.