Expanding the Potential of Office-to-Housing Conversions
Here’s a new way to find prime candidates, according to the latest CommercialEdge report.
As remote and hybrid work become the norm, converting vacant offices into housing has gained attention from owners and policymakers. While this is still a niche market, a new tool from CommercialEdge, the Conversion Feasibility Index, highlights a larger-than-expected pool of candidates for conversion potential. The CFI uses a weighted scoring system to evaluate factors such as building age, location, size and accessibility, categorizing buildings into three tiers based on their suitability for conversion.

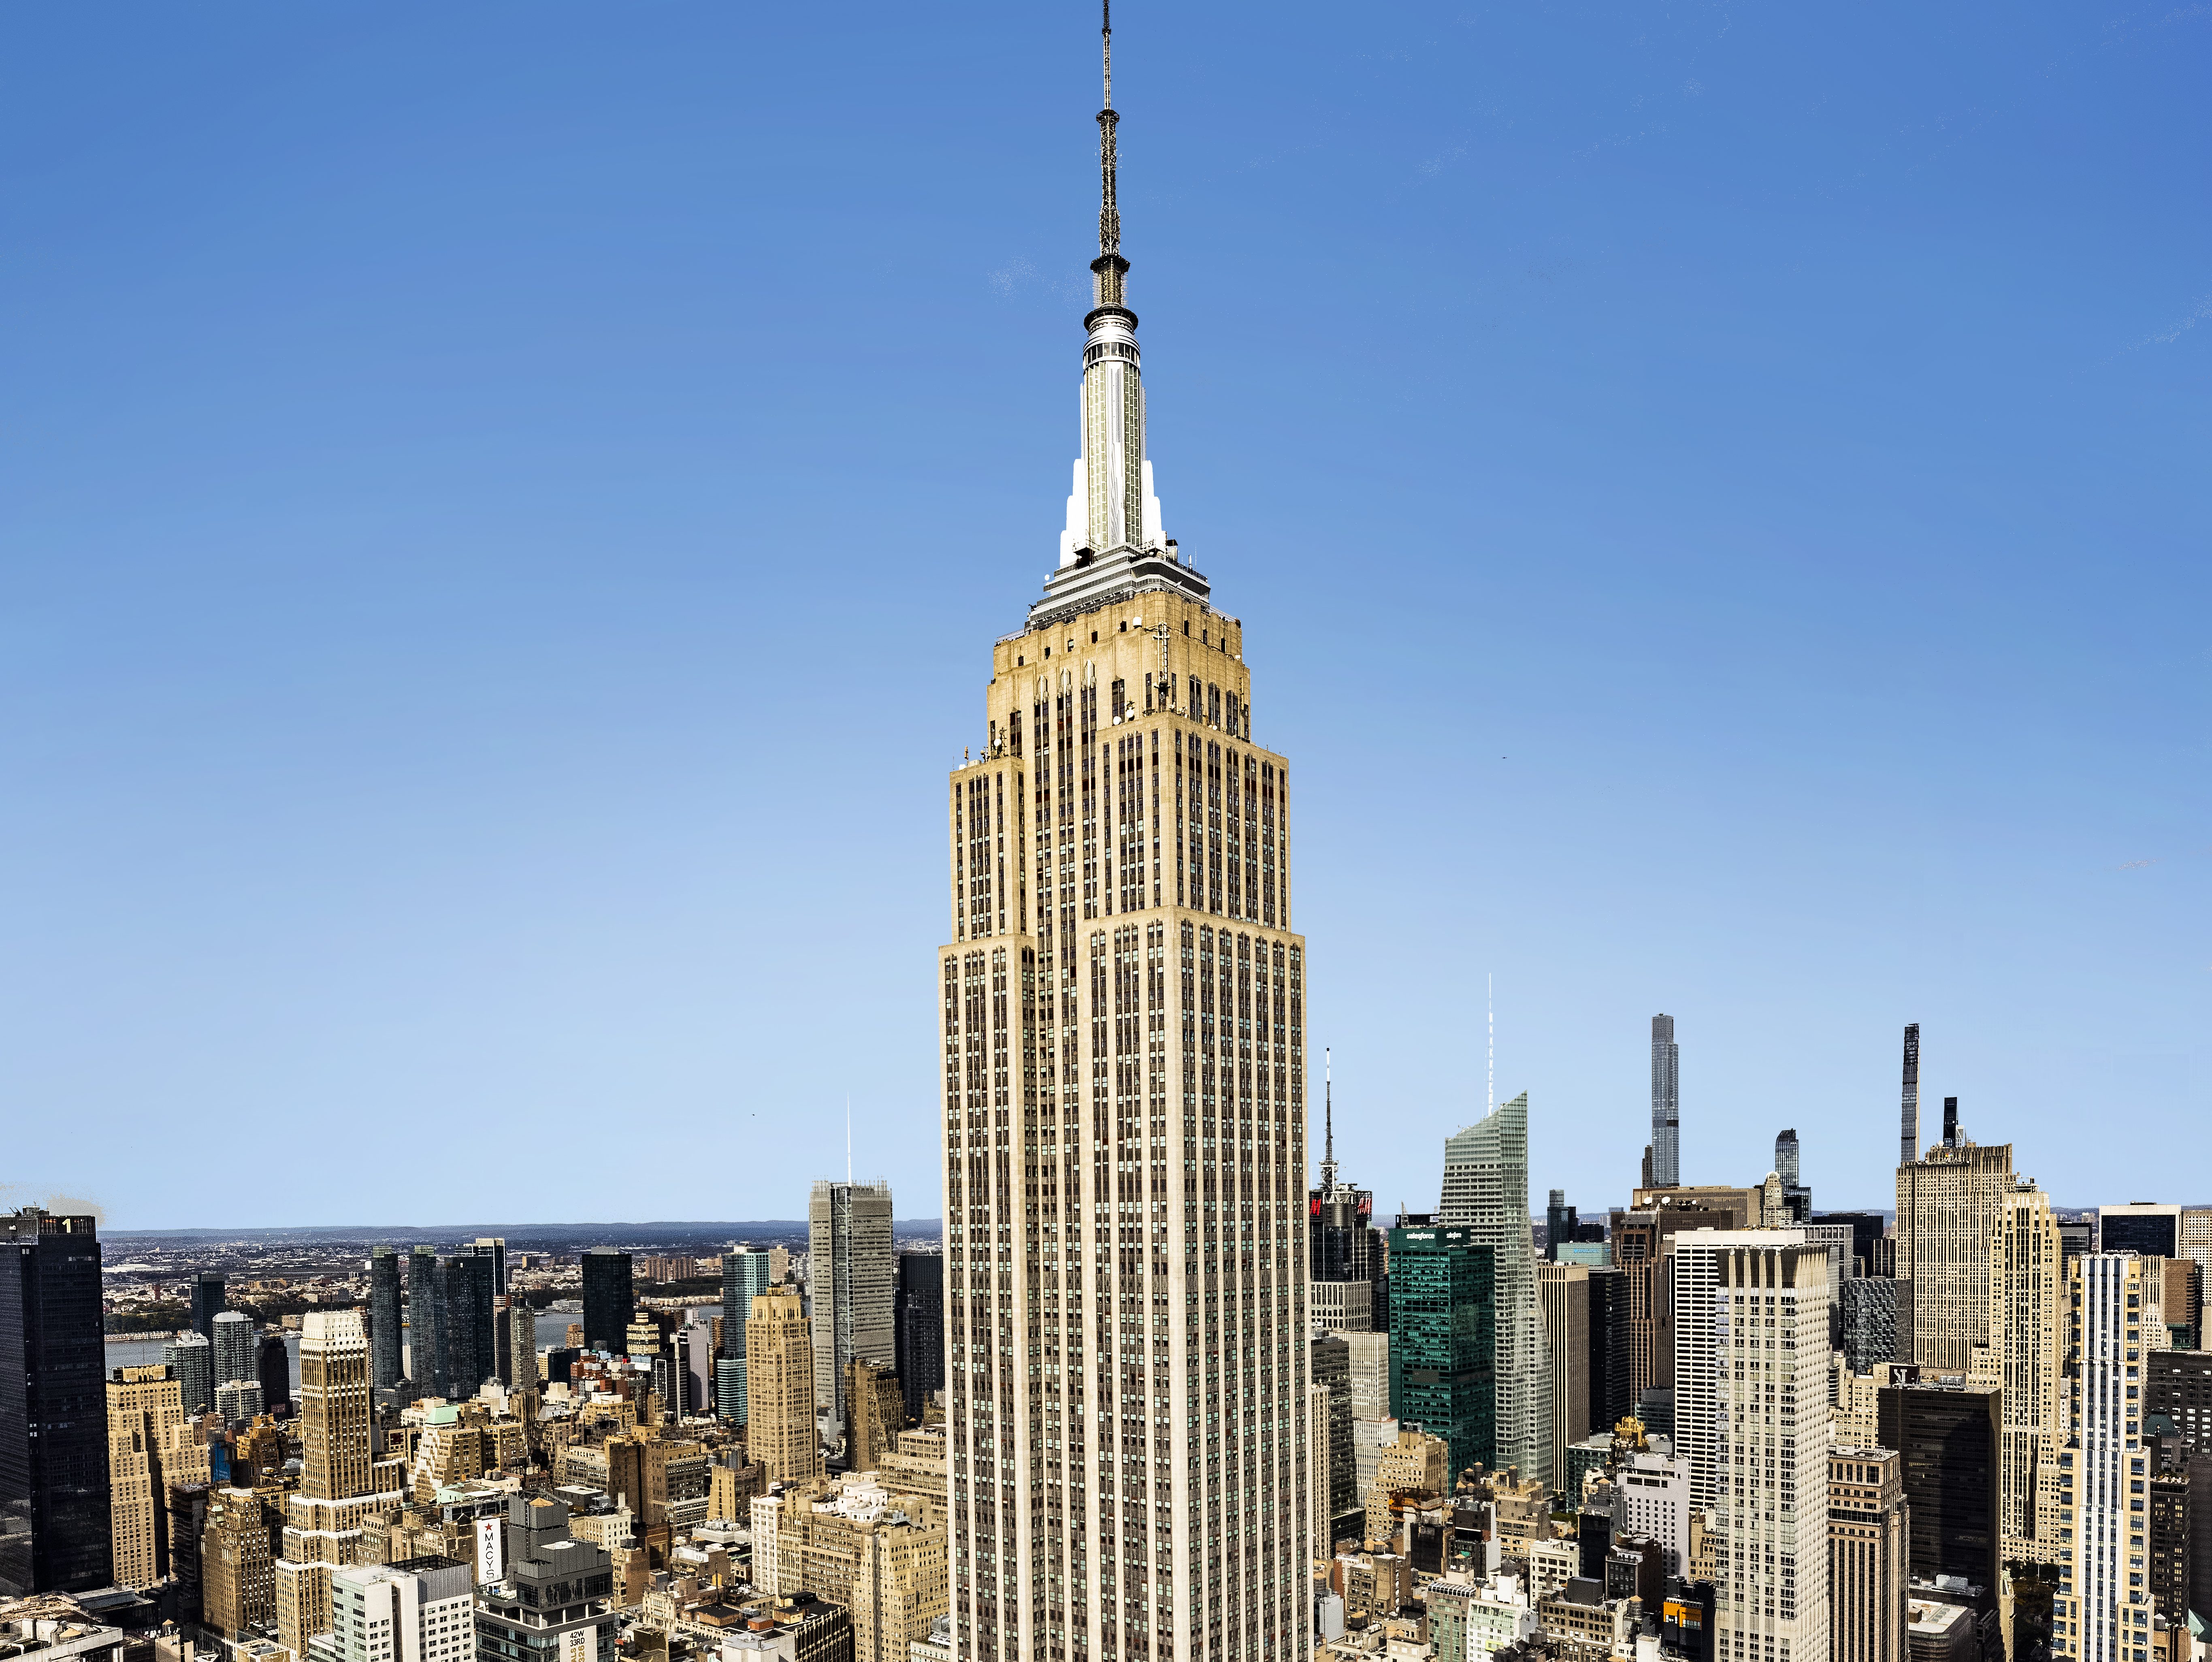
Tier I buildings are prime candidates, Tier II have strong potential but may need adjustments, while Tier III face significant challenges. Currently, more than 228 million square feet of office space (2.7 percent of total stock) is classified as Tier I, with another 1 billion square feet (12.1 percent) in Tier II. Most conversion opportunities are in urban areas, with Manhattan leading the way—16.8 percent of its stock is Tier I and 36.3 percent is Tier II.
Despite the large pool of candidates, many conversion projects remain challenging. Local public initiatives, like New York City’s Office Conversion Accelerator and Washington, D.C.’s Office-to-Anything Program, are working to incentivize these projects. Additionally, declining office property values could make conversions more financially viable, with office sale prices down 40 percent since 2021.
READ ALSO: Can Adaptive Reuse Revitalize US Cities?
In July, office-using employment sectors lost 25,000 jobs. The information sector decreased by 20,000 positions, financial activities shed 4,000 jobs and professional services shrank by 1,000 jobs. Office employment declined in most major markets, with only four of the top 25 showing growth. The Twin Cities led in job losses, down 6 percent year-over-year, followed by Nashville (-4.2 percent), San Francisco (-3.1 percent) and Chicago (-2.7 percent).
The national office vacancy rate clocked in at 18.1 percent at the end of July, a 100-basis-point increase from the same time in 2023, according to CommecialEdge. Vacancy rates have increased across almost all markets, with San Francisco (420 basis points), Dallas (340 basis points), Boston and the Bay Area (280 basis points), Seattle and San Diego (260 basis points) recording the largest year-over-year increases as of July.
National full-service equivalent listing rates averaged $31.67 per square foot in July, unchanged from the previous month. The markets with some of the highest year-over-year increases for in-place rents were Miami (5.9 percent), Dallas (5.2 percent), Atlanta (3.9 percent), Tampa, Fla. (3.9 percent), Philadelphia (2.6 percent) and Boston (2.4 percent).
Life science development grinds to a halt
The office under-construction pipeline continues to further dwarf, featuring 73.8 million square feet underway as of July, representing 1.1 percent of total stock, CommercialEdge data shows. Construction starts have dropped over the past two years, reducing the pipeline by 26 million square feet this year.
Postpandemic, venture capital boosted life sciences, but interest has since declined. New lab space development, which peaked in recent years, has significantly slowed in 2024, with life sciences now making up just 11 percent of all starts, down from more than 25 percent in 2022 and 2023.
Boston, the largest life sciences hub in the U.S., had an active pipeline with nearly 11 million square feet, accounting for 4.4 percent of its total inventory. Austin followed, with 4.3 million square feet of office space under development, or 4.6 percent of stock. Miami ranked third, with 2.8 million square feet (3.9 percent of stock), closely followed by San Diego (3.6 million square feet, 3.7 percent of stock). Nashville had 2.1 million square feet under construction, making up 3.6 percent of total stock.
Office investment in the first seven months of 2024 totaled $17.1 billion, according to CommercialEdge data. At the same time, the average sale price stood at $173 per square foot. Manhattan led the way in office sales, surpassing $2 billion in total, followed by Washington, D.C., with $1.5 billion in transactions. Meanwhile, the Bay Area came in third, with a total of $1 billion in office sales.
Read the full CommercialEdge office report.

You must be logged in to post a comment.