High-Quality Office Product Generates Heightened Investor Interest
Class A assets in urban submarkets accounted for 17 percent of total national sales, according to CommercialEdge.
 As the economy takes steps to recovery, the office sector continues to shift. Hybrid work scenarios and the yet unknown way companies will ultimately utilize office space are keeping investors in a holding pattern. Despite this wait-and-see approach, high-quality assets in urban submarkets are becoming highly sought-after, with sales accounting for 17 percent of the $22.5 billion national sales volume.
These assets traded at an average of $429 per square foot, a 4.5 percent increase from 2020. What’s more, the pandemic has created an unprecedented need for lab space, prompting investors to purchase and reconfigure buildings into spaces for the life sciences sector. Similarly, medical office buildings in urban cores emerged as the priciest assets on a per-square-foot basis.
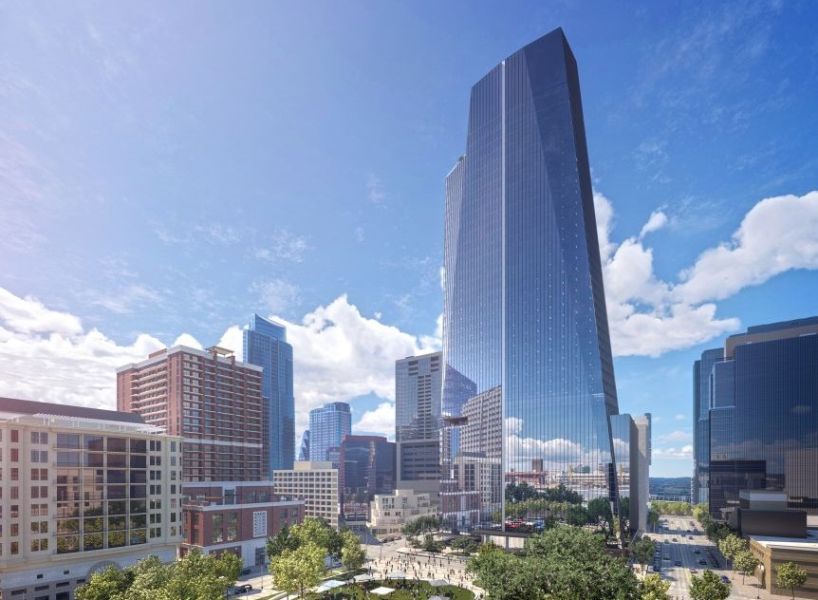
Office-using employment increased by 6.3 percent year-over-year as of April. Despite the positive number, of the 120 markets covered by CommercialEdge, only 19 have more office-using employees than in February 2020. Austin leads the way in this aspect, with the market including 11,160 more jobs than there were in February last year, largely due to corporate headquarters relocations and a tech-centric labor market. Meanwhile, other markets struggle to recover, especially New Orleans (down 12.4 percent since February 2020) and Las Vegas (-11.3 percent).
National average full-service equivalent listing rates clocked in at $38.36 per square foot in May, up 40 basis points year-over-year. Despite pandemic-induced challenges, office rents have increased in most markets, largely due to ongoing influx of new stock, reflecting the quality of the assets available. At a $41.04 per square foot average listing rate, Los Angeles recorded the highest year-over-year rent growth (7.0 percent), followed by the Bay Area ($55.40 per square foot in May, up 5.0 percent).
The active pipeline totals some 160.7 million square feet of office space, with 29 percent taking shape in suburban submarkets. More than 20 million of the 80 million total were completed year-to-date in May. The largest pipelines were in Manhattan (19.3 million square feet underway) and Boston (13.3 million square feet). Development activity continues to be red-hot in Austin, where 7.6 million square feet was under construction as of May, accounting for 10 percent of total stock.
Read the full CommercialEdge report, here.



You must be logged in to post a comment.