Industrial Development Pipeline Shrinks
Less than 100 million square feet started construction in the first half, according to the latest CommercialEdge report.
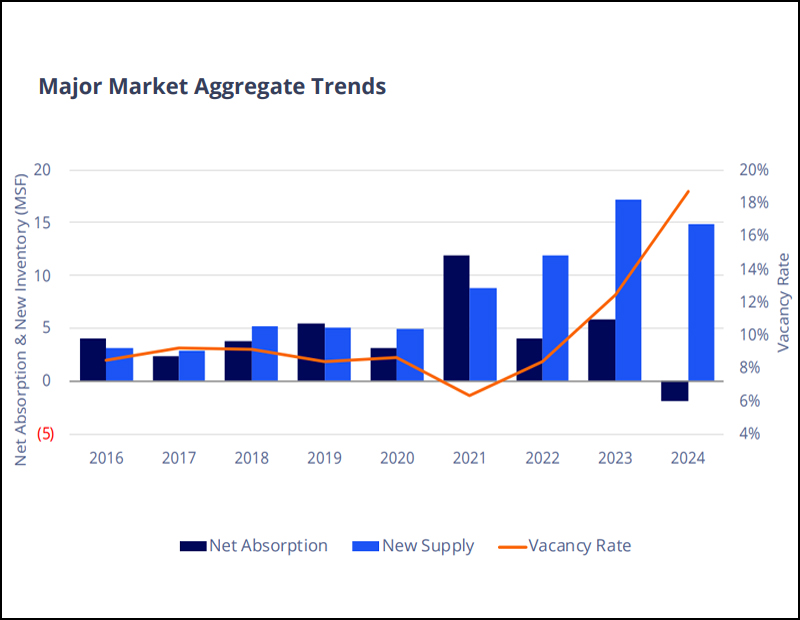
After two years of record industrial space deliveries, the development pipeline has shrunk, the latest CommercialEdge report shows. The new supply entering the market will decline over the next couple of years, but the long-term outlook for industrial development remains strong.
The industrial supply pipeline has decreased for six consecutive quarters, as completed projects outpaced new construction. From 2021 to 2022, more than 1.1 billion square feet broke ground, but new developments dropped to 357.5 million square feet last year and only 97.8 million square feet in the first half of 2024. This slowdown is due to normalized tenant demand, recent high supply, increased construction loan costs and economic uncertainty.
The reshoring of manufacturing significantly impacts industrial real estate. Manufacturing’s share of new projects rose from 7-8 percent annually (2018-2021) to over 13 percent in 2022-2023 and 16.1 percent in 2024. Census Bureau data shows annualized construction spending on manufacturing facilities reached $234.1 billion in May, more than double the amount two years prior. This growth, mainly in semiconductor plants, supports the long-term industrial sector expansion.
READ ALSO: Why 2024 Is the Year to Invest in Industrial Real Estate
The new development pipeline is expected to grow again, although not at recent historical levels. The national under-construction pipeline included 365.7 million square feet of industrial space at the end of June, accounting for 1.9 percent of total stock, CommercialEdge data shows. Projects in planning stages amounted to an additional 561.2 million square feet, driven by manufacturing, data centers, and the shift to e-commerce and omnichannel retail.
The largest pipelines on a percentage-of-stock basis were in Phoenix (9.8 percent, 39 million square feet underway), Kansas City, Mo. (4.6 percent, 13.2 million square feet), Memphis, Tenn. (3.4 percent, 10 million square feet), Columbus (3.2 percent, 9.9 million square feet), Denver (3.0 percent, 8.2 million square feet) and Charlotte, N.C. (3.3 percent, 10.5 million square feet). Meanwhile, industrial sales in the first half of the year totaled $25.1 billion, with properties trading at an average of $139 per square foot.
Coastal industrial rents surge, Midwest remains stable
In June, the national average for industrial space rents reached $8.04 per square foot, a four-cent increase from May and a 7.5 percent rise over the past year, according to CommercialEdge. The Inland Empire led in rent growth with a 12.5 percent increase, followed by Los Angeles at 12.0 percent, Miami at 10.8 percent and New Jersey at 9.6 percent.
In contrast, the Midwest showed the lowest rent growth: Kansas City at 2.5 percent, St. Louis at 3.4 percent, Detroit at 3.6 percent and Chicago at 4.0 percent. The Midwest’s new supply, not constrained by port market limitations, adjusted to demand increases, preventing the high rent growth seen on the coasts.
National industrial vacancy stood at 6.1 percent in June, up 50 basis points from the previous month, according to CommercialEdge data. Vacancy rates keep rising due to slowing demand and an unprecedented influx of new supply entering the market. Vacancy was lowest in Columbus (3.7 percent), Charlotte, N.C. (3.8 percent), Kansas City, Mo. (4.0 percent) and Nashville, Tenn. (4.2 percent).
Read the full CommercialEdge report.


You must be logged in to post a comment.