Industrial Supply Catches Up With Demand
A new CBRE report found the overall availability rate in U.S. markets was 7.0 percent, a very slight decrease that marked the 35th consecutive quarter of decline.
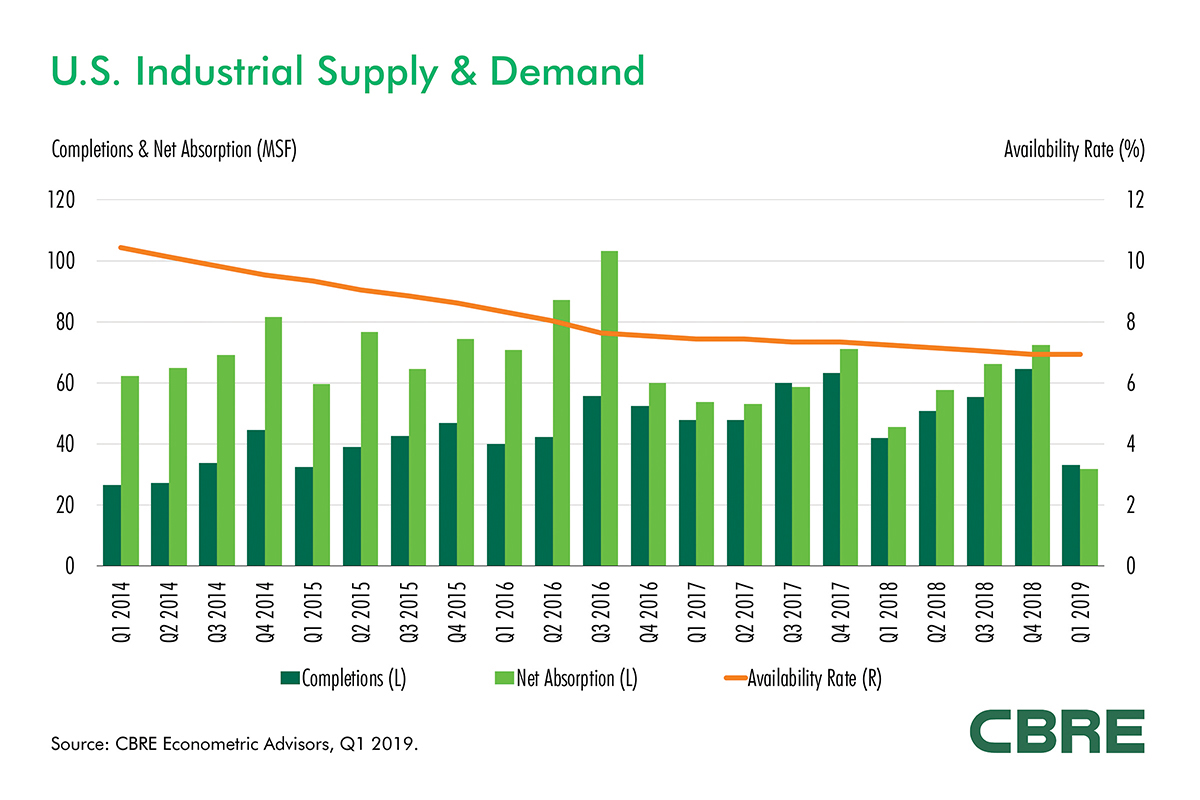
For the first time in a long time, the demand for warehouses in the U.S. roughly matched the demand of the newly constructed supply leading to a relatively flat absorption rate for the first quarter of 2019, according to a new industrial and logistics report from CBRE.
The availability rate in the first quarter was 7.0 percent, a decline by less than half of a basis point and the lowest since 2000. Though slight, the dip marked the 35th consecutive quarter of declining availability, the longest since CBRE began tracking the data in 1988.
“Net absorption should pick up through the rest of this year in step with the economy,” Richard Barkham, CBRE global chief economist, said in a prepared statement. “We expected a tepid start to the year, in part due to a weaker global economy and stock market turbulence at the end of last year, but the overall picture is a nicely balanced industrial sector, with demand and supply broadly in line.”
Although supply and demand were mostly in balance, net asking rents rose 2.2 percent in the first quarter, to $7.51 per square foot—the highest level since CBRE began tracking that statistic in 1989. Rents increased 8.1 percent year-over-year, the highest growth rate in this cycle and well above the average annual growth rate of 4.4 percent since 2012.
Barkham said the sector expects to continue to benefit from the ongoing structural shift to e-commerce and healthy levels of consumer spending. Other positives for the continued strength of the industrial market are the continued strength of the U.S. dollar, rising nominal incomes and low inflation which will likely lead to more imported goods, according to CBRE.

David Egan, Senior Director of Investor Services & Global Head of Industrial Research, CBRE. Image courtesy of CBRE
CBRE found aggregate net absorption across 55 U.S. markets for the first quarter was 32 million square feet, nearly matching the 33 million square feet of new warehouse supply completed during the quarter. That number was down 48.6 percent quarter-over-quarter and 20.5 percent year-over-year, which is a sign of discipline by developers wary of a late-cycle oversupply. The report also found the amount of new supply under construction grew 4.6 percent quarter-over-quarter to 283.1 million square feet.
“The supply pipeline is not expected to grow at a meaningfully higher rate than it has over the past several quarters (about 2 to 4 percent). This tells us that the delivery rate will not grow much either, and that approximately 220 to 230 million square feet of annual supply is what we should expect over the next couple years,” David Egan, CBRE senior director, Investor Services, and global head of industrial research, told Commercial Property Executive.
Market availability breakdown
CBRE defines availability as the sum of vacant space plus space that is currently occupied but otherwise being marketed for use by new tenants. In the first quarter, CBRE found 30 of the 55 markets had declines in availability from the fourth quarter of 2018. Eight were unchanged and 26 markets reported increases.
The markets with the lowest first quarter availability rates were: Detroit (3.1 percent); Salt Lake City (4.2 percent); Milwaukee and Portland (4.3 percent); Las Vegas and San Francisco Peninsula (4.4 percent); and Cincinnati, Cleveland and Los Angeles (4.5 percent). Those with the highest availability rates were: San Antonio (12.7 percent); Austin (11.7 percent); Nashville (11.1 percent); Greenville (10.8 percent); and Walnut Creek/I-680 Corridor (10.6 percent).
“Of the 20 markets with the lowest vacancy rates, only four—Inland Empire, Las Vegas, San Francisco and Salt Lake City—are among the top ten in terms of under-construction rate (under construction divided by total stock). There is not much relief coming in the tightest markets,” Egan said.


You must be logged in to post a comment.