

Labor/Economy
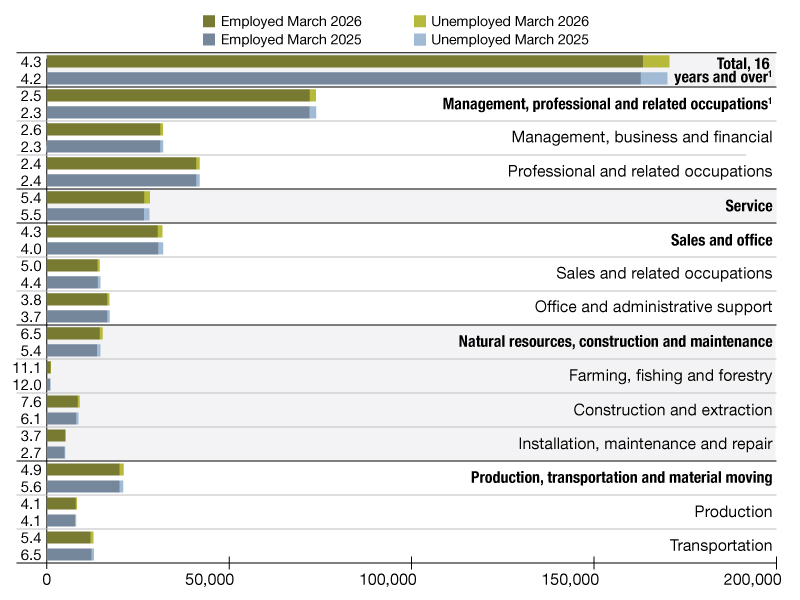
2026 Employment Picture
The latest year-over-year comparison by the Bureau of Labor Statistics, updated monthly.
2025 Employment Picture
The latest year-over-year comparison by the Bureau of Labor Statistics, updated monthly.

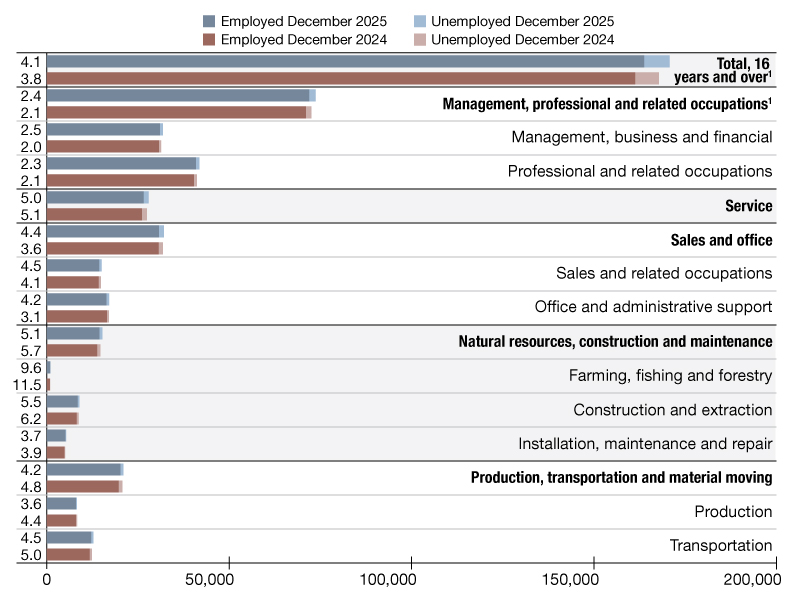
2024 Employment Picture
The latest year-over-year comparison by the Bureau of Labor Statistics, updated monthly.
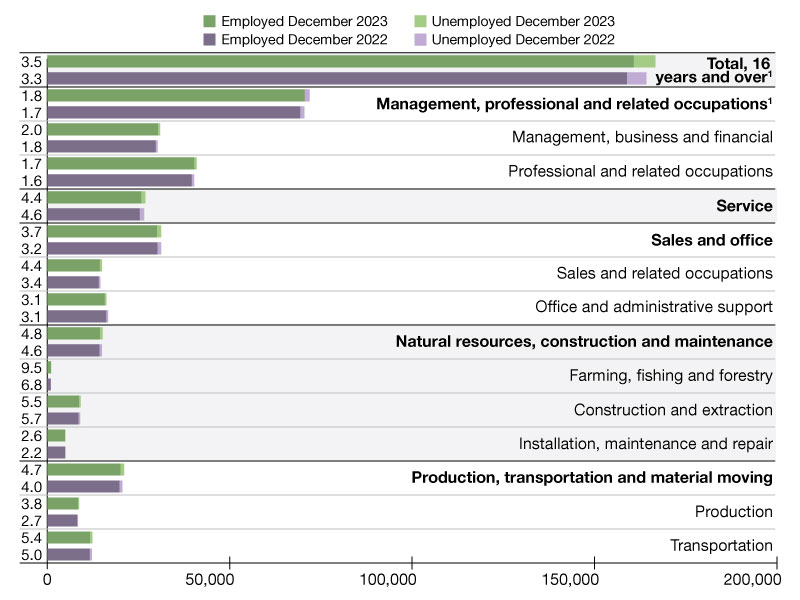
2023 Employment Picture
The latest year-over-year comparison, updated monthly.
2022 Employment Picture
The latest year-over-year comparison, updated monthly.
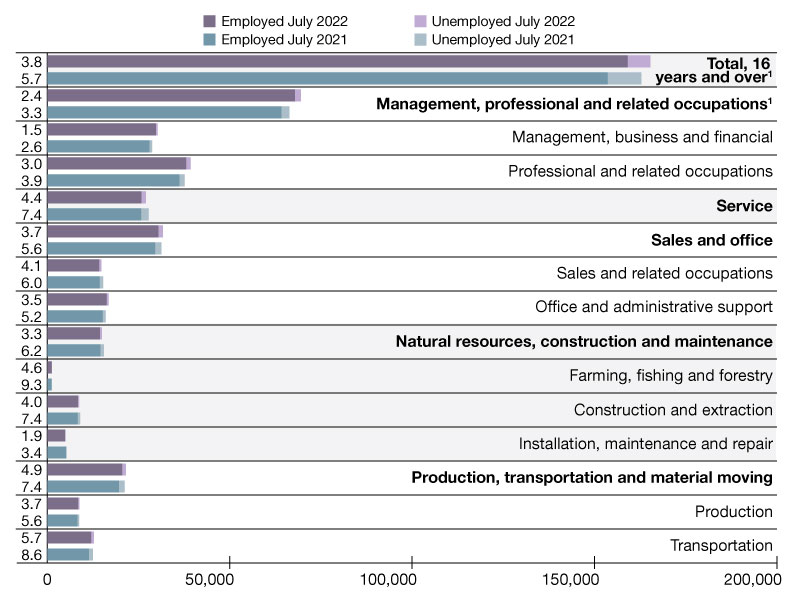
2021 Employment Picture
The latest year-over-year comparison, updated monthly.
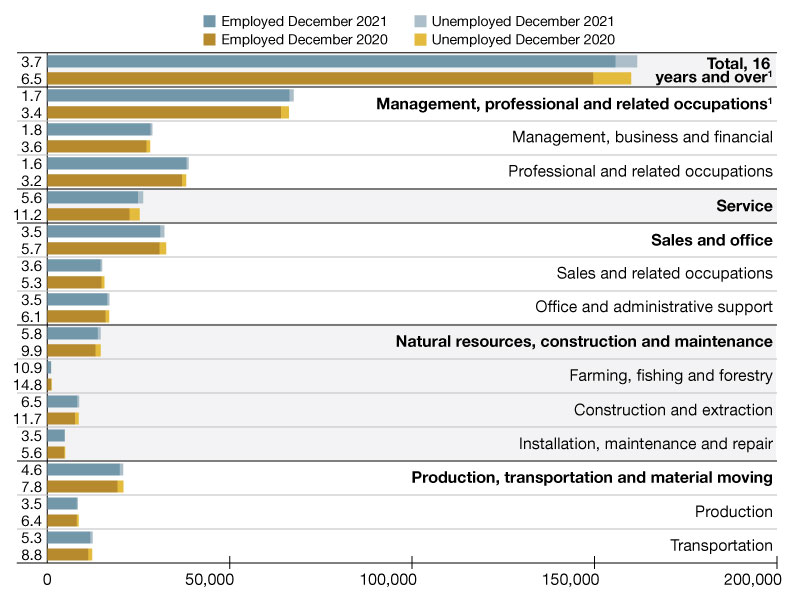
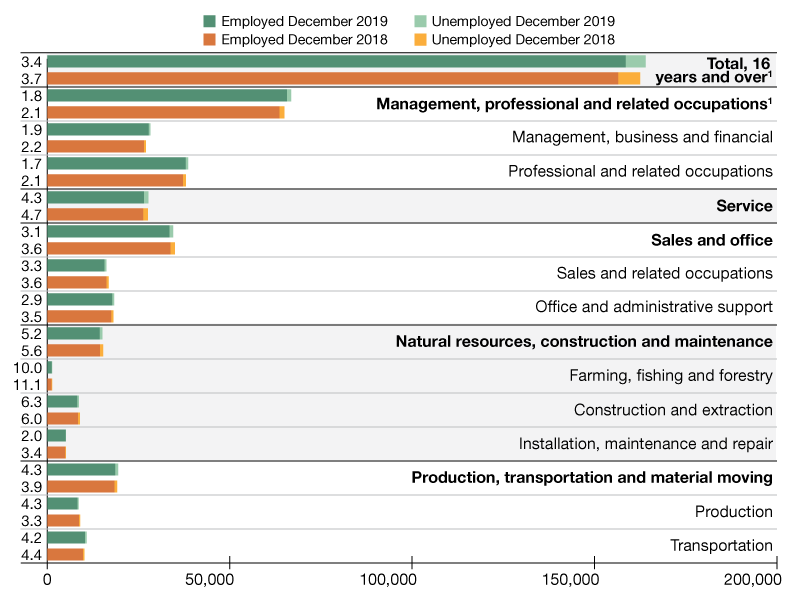
2020 Employment Picture
The latest year-over-year comparison of employed and unemployed persons by occupation, updated monthly.
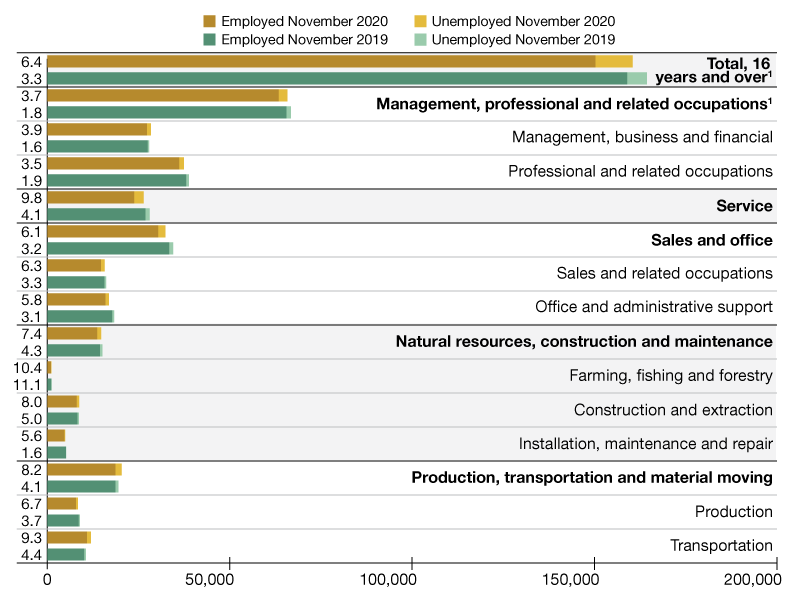
2019 Employment Picture
The latest year-over-year comparison of employed and unemployed persons by occupation, updated monthly.
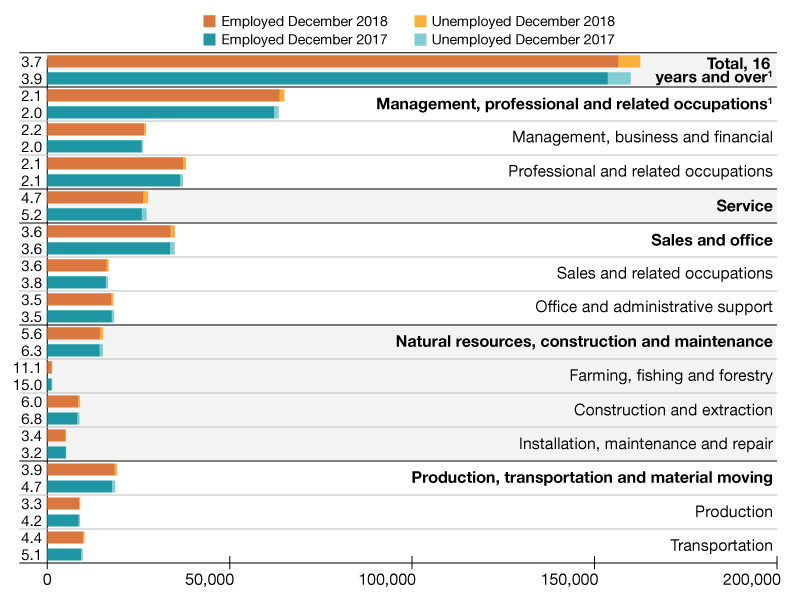
2018 Employment Picture
The latest year-over-year comparison of employed and unemployed persons by occupation, updated monthly.