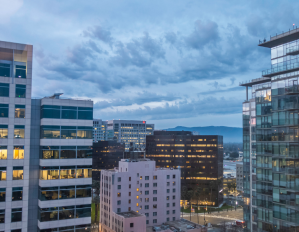
Life Science Assets Maintain Lasting Appeal
The average sale price for these properties is 150 percent higher than for general office buildings, the latest CommercialEdge report finds.
 The life sciences sector has been benefitting from a steady expansion for several years even before the pandemic, with the health crisis acting as a growth driver. Today, lab space is commanding record-breaking prices, while investors are betting big on the sector’s strength. According to the most recent CommercialEdge national monthly office report, life science facilities this year traded for an average of $645 per square foot, or 150 percent more than the average sale price office buildings traded at ($258 per square foot).
Although some 21.6 million square feet of lab space was underway nationally as of August, demand for niche space exceeds supply. Construction activity continues to be concentrated in the nation’s largest life science hubs, such as Boston (8.4 million square feet underway), San Diego (2.9 million) and San Francisco (2.6 million), while supply has also been growing in tertiary life science markets such as Denver, Phoenix or Pittsburgh.
READ ALSO: Is a Life Science Real Estate Bubble Forming?
National average full-service equivalent listing rates averaged $38.70 per square foot at the end of August, down 10 basis points year-over-year. The national office vacancy rate continued its downward trend: it reached 14.8 percent in August, down 10 basis points on a year-over-year basis and 30 basis points lower than the prior month, according to CommercialEdge.
As highly amenitized, brand new stock keeps being added to the market, average listing rates increased dramatically in markets such as Boston, where listing rates have soared 17.7 percent in the last year. Charlotte followed closely with a 16.2 percent year-over-year increase, while San Diego came in third with an 11.8 percent growth.
Planned stock holds strong
Some 139.9 million square feet of office space was under construction across the nation at the end of August, representing 2.2 percent of total inventory. When factoring in planned stock to the under-construction pipeline, the total figure reaches a whopping 6.1 percent of total stock.
Going forward, CommercialEdge will report new office development differently by taking into account the amount of rentable office space within a property. Following this change, the total amount of office space under construction is reduced by 11.9 million square feet. The largest pipelines on a percentage of stock basis were in Austin (10.7 percent, 8.8 million square feet), Charlotte (7.7 percent, 5.8 million square feet), Nashville (5.6 percent, 3.2 million square feet) and Boston (5.3 percent, 12.5 million square feet).
Read the full CommercialEdge report.


You must be logged in to post a comment.