

Manhattan Office Visits Up Year-Over-Year: REBNY
Additionally, the average for most of July outpaced the previous month’s record.
While down slightly from June, Manhattan office visitation in July continued to climb closer to pre-pandemic levels and increased an average of 6 percentage points year-over-year with the Class A+ buildings seeing a 9 percentage-point bump compared to July 2023, according to a Real Estate Board of New York report.
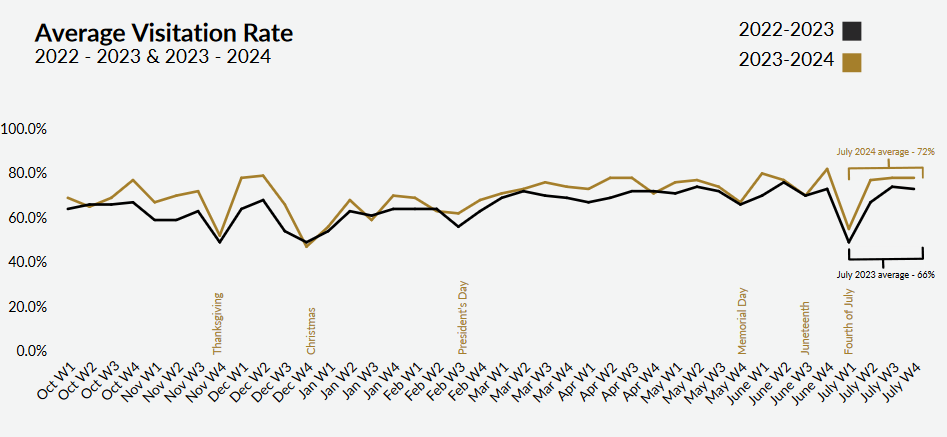
One day after Labor Day, and the unofficial end to summer, REBNY issued its latest monthly analysis of Placer.ai location data in 350 Manhattan office buildings for July. For the full month, Manhattan office buildings had an average visitation rate of 72 percent of the 2019 levels. The first week of July had only 55 percent visitation rates. When the week of the Fourth of July holiday was excluded, the data showed the final three weeks of July had an average visitation rate of 78 percent, 1 percentage point higher than June’s average of 77 percent. June had set a post-pandemic record.
The Placer.ai report tracks mobile data of office tenants and their employees. It also reflects office visitors and retail customers and employees within buildings with retail space. The properties analyzed include a representative sample of various types of office buildings. Those that were not completed by 2019 were not factored into the report or in the 2023 average visitation rates.
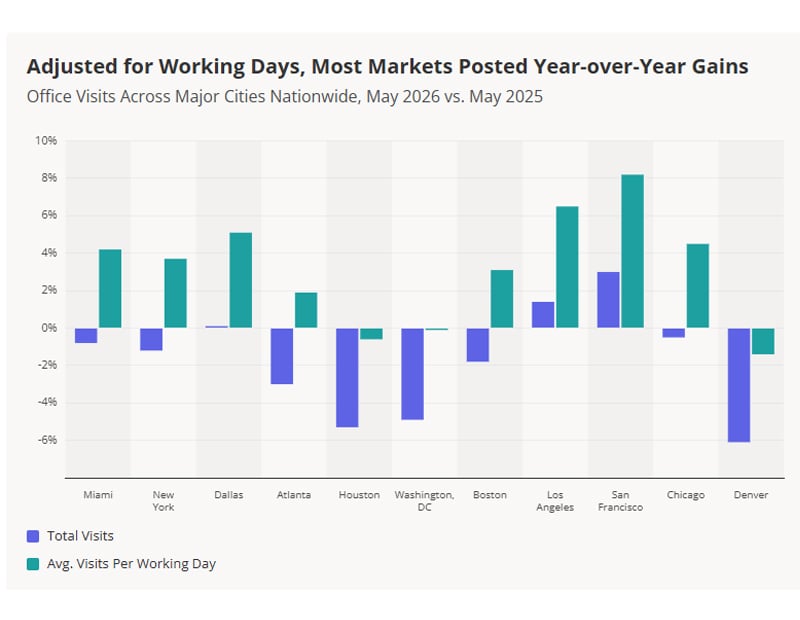
A national report by Placer.ai also found office visits in June were continuing an upward climb back to pre-pandemic levels with visits down 29.4 percent compared to June 2019. In that survey, Miami fared the best with its visits down by 9.8 percent compared to June 2019. The national report stated New York City visits were down 14.2 percent.
“October is the next key month to look at as it will not include any significant holiday weeks. We are curious to see if visitations will reach a new peak then,” Keith DeCoster, vice president of research at REBNY, told Commercial Property Executive.
DeCoster said when the Fourth of July week was excluded, Manhattan office buildings maintained June’s momentum. He noted that newly constructed or renovated properties, as well as some Class B buildings with prime access to transit, continued to outperform.
READ ALSO: Here’s a Surprising Shift in Remote Work’s Appeal
The report found average building visitations in the highest quality Class A+ buildings reached 86 percent in July, down from 91 percent in June, but up 9 percentage points year-over-year. Class A/A- visitations declined by 4 percentage points from June to 71 percent, but were well above the 63 percent level recorded in July 2023. Class B and C buildings included in the survey saw a month-over-month decline from 75 percent to 69 percent as of July, while being up 1 percent year-over-year.
There has been steady improvement throughout the year at Manhattan office assets. Data showed there were 15.2 million total device visits in July, a 10 percent increase over the 13.9 million total device visits in July 2023.
“Even though it may not always feel like it, the COVID-19 pandemic was quite some time ago. It’s becoming more the norm for occupiers to expect office workers to come in three to four times a week,” DeCoster told CPE. “While there was substantial progress in visitation rates through 2023, during the first half of the year, return-to-office policies were still not as defined.”
A recent survey from CBRE found about 80 percent of organizations have a return-to-office policy, but only 17 percent actively enforce it. Despite the low enforcement rate, one-third of corporate real estate executives told CBRE they wanted more in-office attendance.
Markets vary as Midtown rules
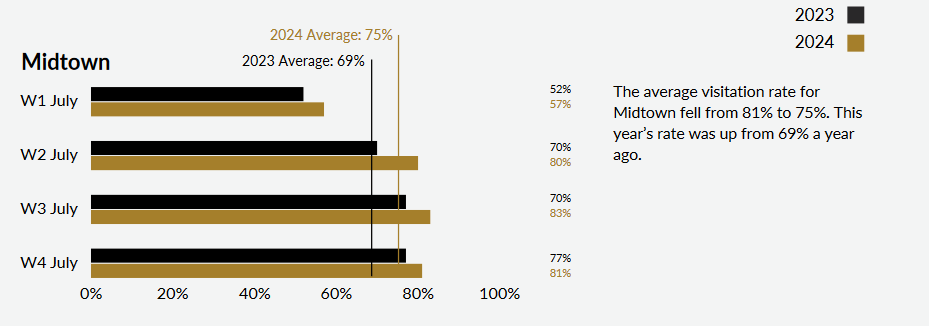
The report breaks Manhattan down into three submarkets—Midtown, Midtown South and Downtown. All three submarkets were up year-over-year but down 5 to 6 percentage points from the June average. Midtown buildings tracked by Placer.ai continued to attract the highest average visitations, reaching 75 percent of pre-pandemic baselines in July.
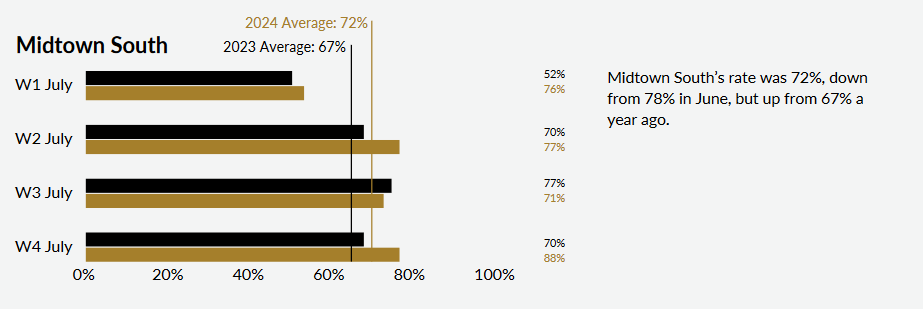
The Midtown rate was just above Midtown South’s July visitation rate of 72 percent and well above Downtown’s visitation rate of 64 percent. It was the fifth straight month Midtown has had the highest rate.
In Midtown, the average July visitation rate was up from 69 percent the previous year. In Midtown South, the average July visitation rate was down from 78 percent in June but up from 67 percent in July 2023. Although there was a dip from 69 percent in June to 64 percent in July for Downtown, the average visitation rate was up from 58 percent in July 2023.

Asked about the Lower Downtown average visitation rates, DeCoster acknowledged there were fewer A+ buildings in that submarket than in Midtown and Midtown South. But he said there are “some that are performing great” in Downtown Manhattan.
“A more significant issue for downtown visitation rates is distance to regional transportation hubs like Grand Central and Penn Station,” DeCoster said.


You must be logged in to post a comment.