Market Snapshot: Austin Leads the Lists
At least three fundamental drivers make Austin an appealing target for businesses looking to expand or relocate.
By Anca Gagiuc, Associate Editor
Austin has again positioned itself at the top of several national lists for best employment growth, best places to do business, and best city for young professionals. At least three fundamental drivers—economic strength, record job growth, and favorable business environment—make Austin an appealing target for businesses looking to expand or relocate and keep commercial real estate investors interested to capitalize on the city’s economic success.
As of the first quarter of 2015, seasonally adjusted unemployment improved nationally dropping by 30 basis points to settle in at 5.6 percent, with Austin being among the top cities registering in at 3.9 percent. Job growth continues to be strong, reflecting a 4 percent growth in seasonally adjusted year-over-year office job growth, according to Moody’s Analytics.
Recent market data collected by CBRE indicates that the Austin office market marked its 17th consecutive quarter of positive net absorption, finishing at 442,682 square feet. This reflects a 124,047 square feet increase from the previous quarter and a year-over-year gain of 198,054 square feet. CBD posted the leading volume at 139,236 square feet, 37,374 square feet less than Q4 2014. Total vacancy increased to 12.8 percent, partly due to the completion of construction and delivery of two new office projects, mostly preleased. The Northwest submarket follows CBD with 111,130 square feet of absorption, or 25,755 square feet more than Q4 2014. The Southwest submarket registered a gain of 66,172 square feet of net absorption, which accounts for an increase of 36,971 square feet quarter-over-quarter. However, the submarket witnessed a 45,623 square feet decrease in net absorption for Class B space, yet offset by the 108,078 square feet gain in Class A space. Round Rock is the only submarket to show negative net absorption in Q1. CBRE data shows that the submarket ended the first three months of 2015with a net absorption of 8,900 square feet.
The highest total vacancy registered in Q1 2015 was 14.9 percent, in the South submarket. The North Central submarket followed with a total vacancy of 14.2 percent, while the total vacancy posted by the far Northwest was 13.9 percent.
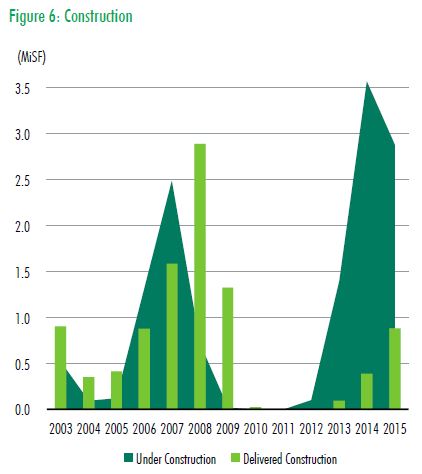
In Q1 2015, the Austin office market delivered 881,095 square feet of space divided into five buildings. 516,485 square feet were delivered in the CBD: 373,334 square feet in the Colorado Tower and 143,151 square feet in the Seaholm redevelopment; both projects were mostly preleased. Two buildings were delivered in the Northwest also: Champion I of 115,000 square feet and the Domain 7 of 221,973 square feet. The Southwest received 27,637 square feet of office space in Rialto B.
At the end of Q1 2015, the Austin market had 2.8 million square feet of office space under construction, with one third of the amount already preleased. The Southwest submarket registered the most buildings under construction, with 8 totaling 1,123,663 square feet of product.
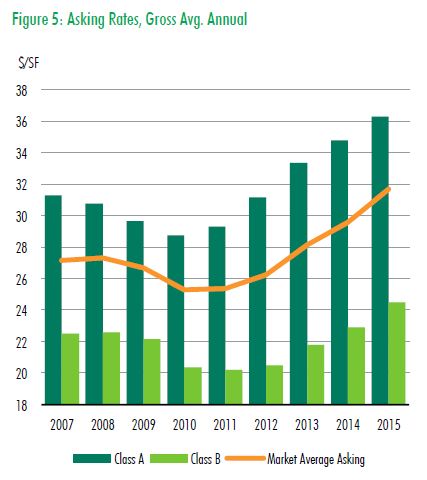
Citywide office average asking rates reached a new high this quarter, coming in at the full service gross value of $31.66. The jump occurred firstly due to the increase of taxes and operating expenses that are included in the full service gross value, but also due to the success of the Austin market which increased property taxes along the property values. Additionally, the large addition of 880,000 square feet of new product of higher quality than the market average influenced rates, pushing the citywide average up. Furthermore, low vacancy and high demand put more pressure on asking rates. Citywide Class A average asking rates rose up to $36.27, Class B rate came in at $24.48, and Class C finished Q1 2015 at $23.05.
Charts and data courtesy of CBRE



You must be logged in to post a comment.