NOI vs. Capex Yield
Variables such as age, location and property type can influence how much capex is required to operate an asset.
Percentage over time, by sector
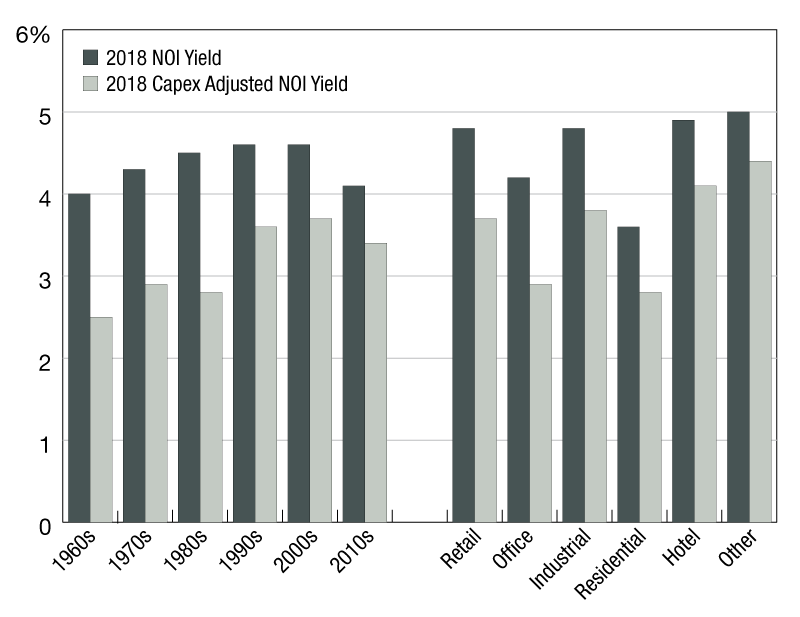
Income is an important part of real estate returns, meaning yields are often heavily scrutinized by investors. But headline yields often do not factor in capital-expenditure (capex) requirements. Variables such as age, location and property type can influence how much capex is required to operate an asset. Investors looking to understand the potential “free cash flow” position of assets or portfolios post-capex may want to adjust the yields they use to account for it.
This chart uses 2018 data from the MSCI Global Annual Property Index to compare Net Operating Income (NOI) yields against capex-adjusted NOI yields. The first notable observation is that the adjustment for older assets was larger than for newer assets (which is understandable, given older buildings can require more maintenance expenditure). Thus, while assets built in the 1960s and the 2010s had NOI yields of 4.1 percent and 4 percent, respectively, after adjusting for capex, the gap was much wider with 1960s and 2010s buildings, yielding 2.5 percent and 3.4 percent, respectively. We can also see that at the headline level, NOI yields for office assets in 2018 were 4.2 percent—60 basis points higher than for residential assets. However, after factoring in capex, the adjusted yields for office were 2.9 percent, only slightly higher than the 2.8 percent for the residential sector.
Insights and data provided by MSCI Real Estate, a leading provider of real estate investment tools. A Vice President in MSCI’s global real estate research team, Reid focuses on performance measurement, portfolio management and risk related research for asset owners and investment managers. Based in Sydney, he covers APAC as well as global markets.


You must be logged in to post a comment.