Property Metrics
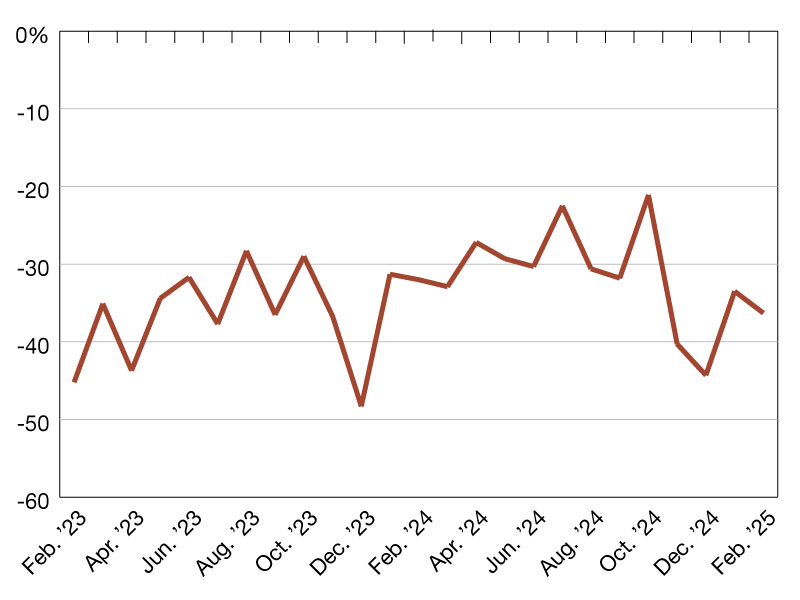
Placer.ai Office Index—February 2025 Recap
Find out how visits are trending in major cities.
2025 CMBS Delinquency Rates
Trepp’s monthly update. Read the report here.
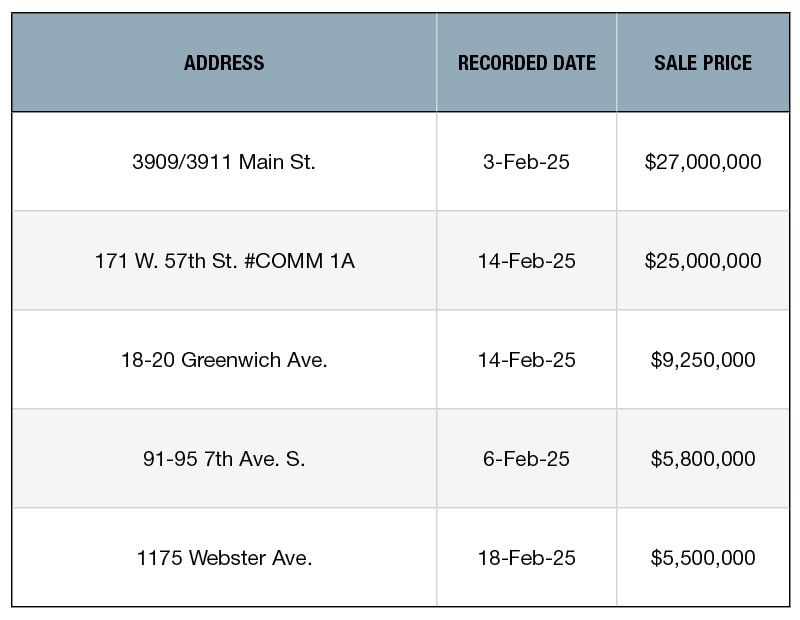
Top 5 NYC Retail Building Sales—February 2025
A recap of recent major transactions compiled by PropertyShark.
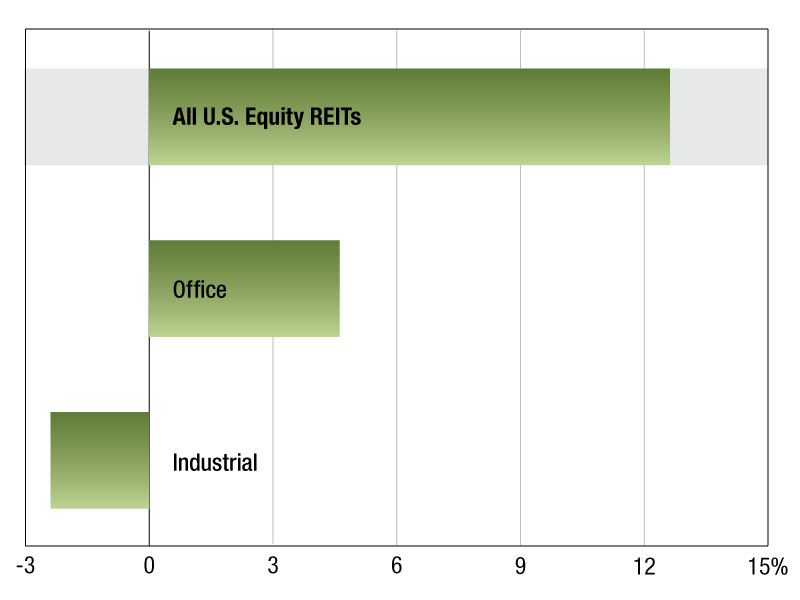
2025 REIT Returns
The Dow Jones Equity All REIT Index’s latest update on performance, from S&P Global Market Intelligence.
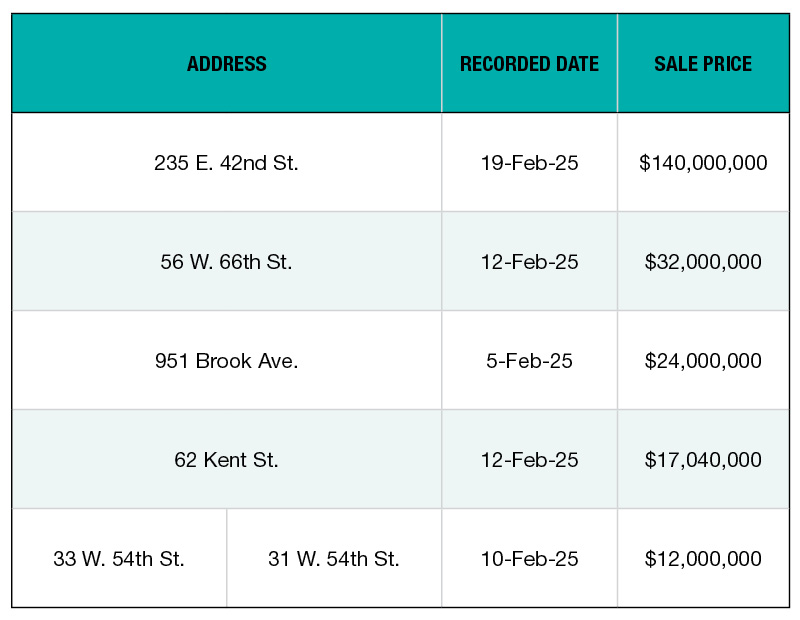
Top 5 NYC Office Building Sales—February 2025
A recap of recent major transactions compiled by PropertyShark.
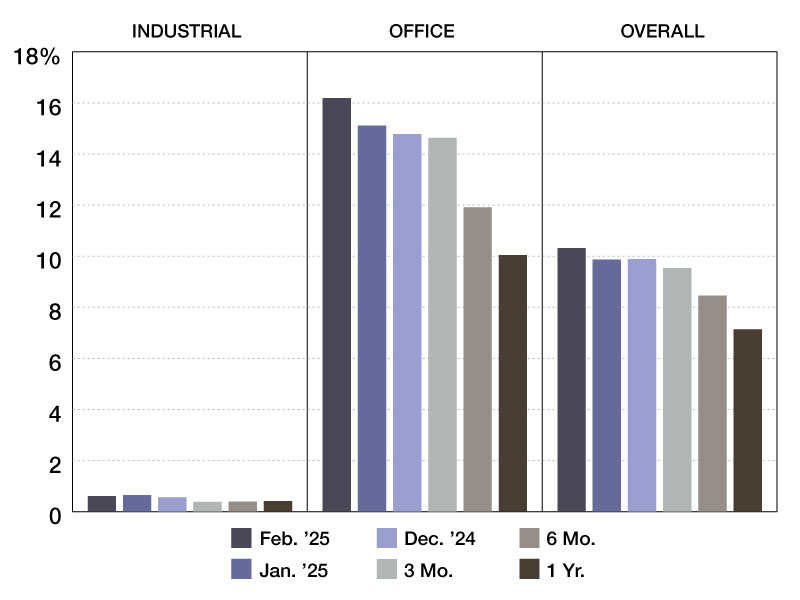
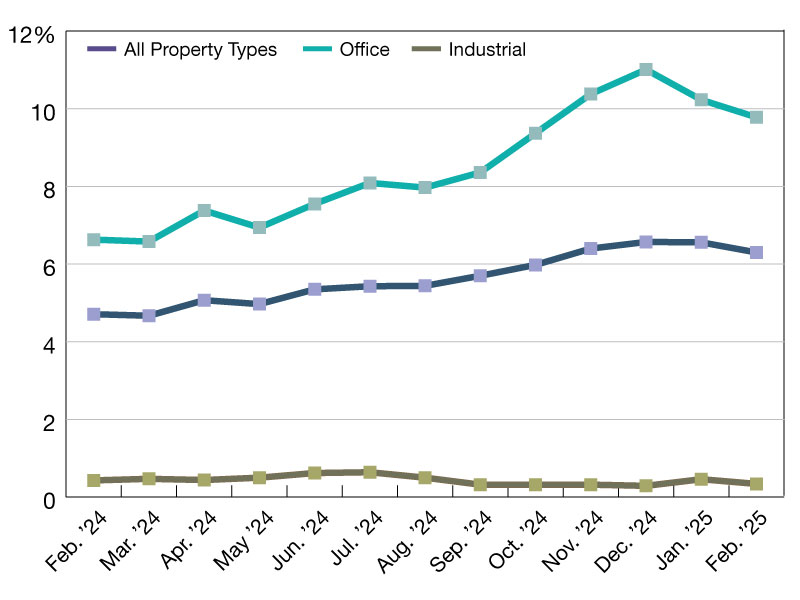
2025 Special Servicing Rates
Data from Trepp’s latest report.
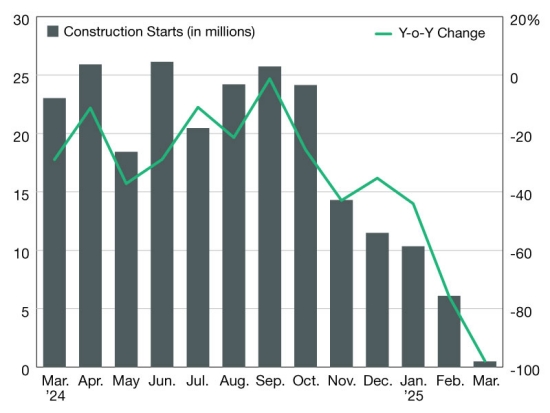
Industrial Construction Starts Struggle in Early 2025
Groundbreakings declined sharply this year, compared to the same period in 2024, according to CommercialEdge data.
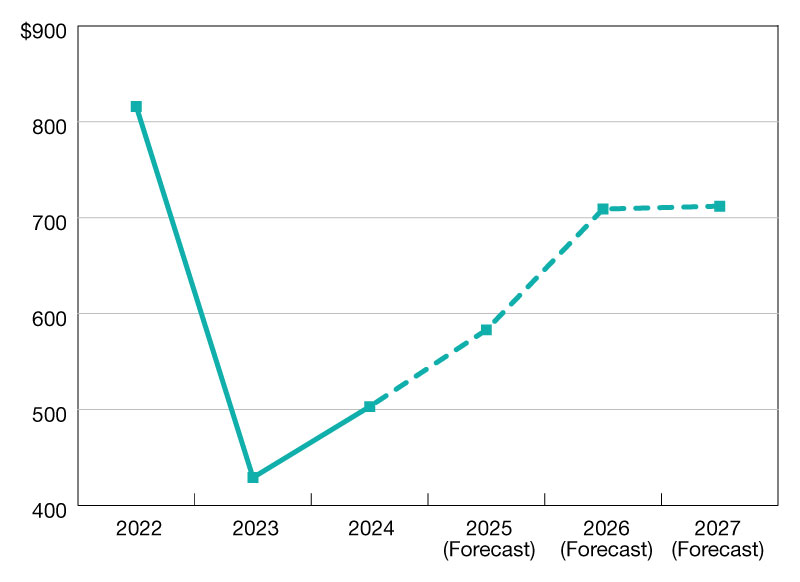
Lending Expected to Reach $583B in 2025
The Mortgage Bankers Association forecasts a 16 percent year-over-year increase.
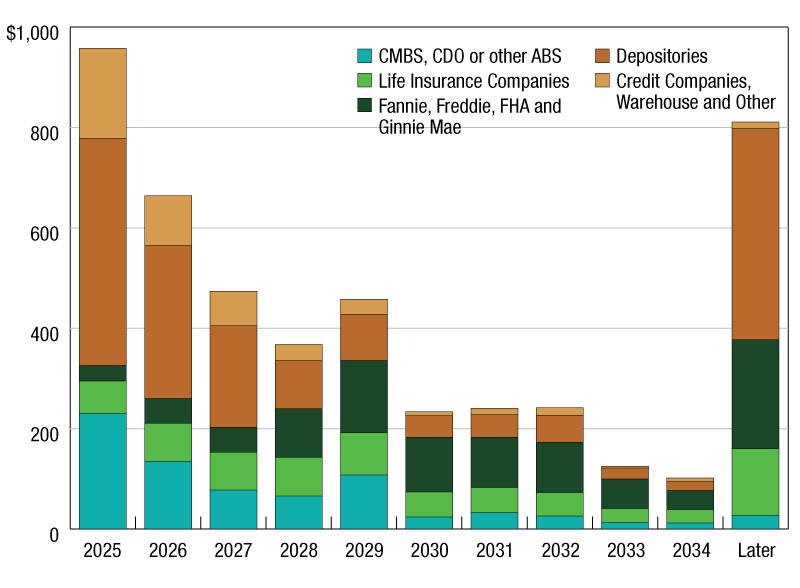
20 Percent of Commercial and Multifamily Mortgages Mature in 2025
An update from the Mortgage Bankers Association. Read the report.