San Francisco Office Market Begins 2025 on a High Note
The market has registered some impressive sale prices this year, according to CommercialEdge.
In the first two months of 2025, San Francisco continued to post the highest office vacancy rate in the nation. Meanwhile, other fundamentals showed significant improvement, when compared to the same period last year, according to the latest CommercialEdge data.
Despite developers breaking ground on a single office project, the metro’s pipeline emerged as one of the largest in the country in terms of square footage. Similarly, the market’s transaction volume improved, showing a significant year-over-year growth, and placed it among the top performers in gateway metros. Despite a surge in discount deals nationwide, San Francisco’s office prices remain among the highest in the country.
San Francisco’s vacancy rate remains high
San Francisco’s vacancy rate continued its upward trajectory, clocking in at 27.8 percent as of February—above the national figure of 19.7 percent. The global tech hub posted the highest rate among comparable metros, with only Austin—a fellow tech market—coming close at 27.4 percent. In contrast, the lowest vacancy rate was Miami’s 15.7 percent, with Manhattan’ followed with ‘s rate reaching 16.4 percent.
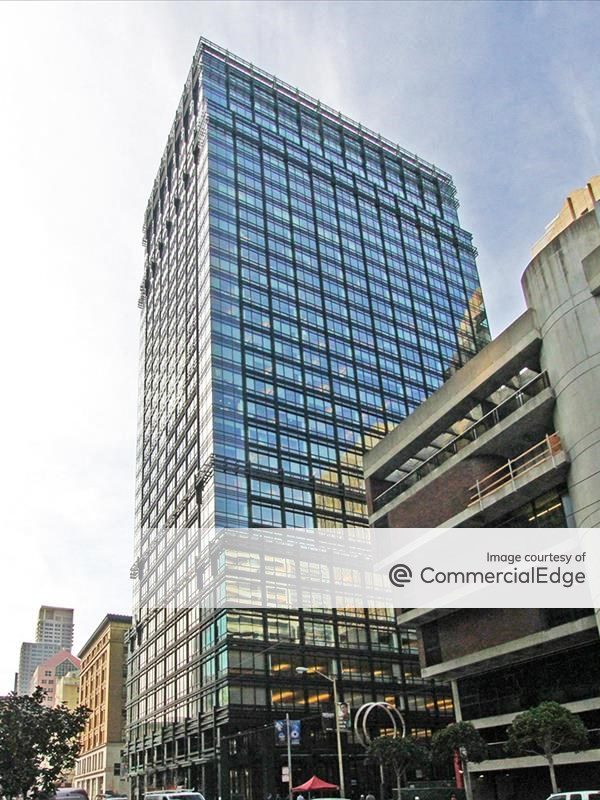
Notable leases signed in the metro since the start of the year include JPMorgan Chase’s 280,000-square-foot renewal and expansion deal at 560 Mission St. In January, the company expanded its commitment at Hines’ office high-rise by 60,000 square feet for the next five years.
In another noteworthy deal, Chan Zuckerberg Institute signed a 226,000-square-foot lease at IQHQ’s Elco Yards district in Redwood City, Calif. The transaction was one of the largest biosciences commitments in the Peninsula market and the biggest new lease in San Mateo County. CZI will fully occupy one of the four buildings at Elco Yards.
Third-largest office pipeline in the U.S.
As of February, San Francisco’s under-construction pipeline comprised 3.2 million square feet of space underway spread across 16 properties, representing 2 percent of existing stock—above the national average of 1 percent. Among gateway markets, Boston led the rankings with 2.5 percent.
When adding projects in the planning stages, the metro’s figure reached 6 percent—surpassing the national average of 2.6 percent, as well as that of Los Angeles (3.4 percent) and Washington, D.C. (3.3 percent). Boston remained in first place with 7.2 percent.
San Francisco had the third-largest office pipeline in the nation in terms of square footage, ahead of Manhattan (2.7 million square feet), Los Angeles (2 million), and Miami (1.7 million). Boston led the country, with 6.6 million square feet of office space underway.
Year-to-date through February, the list of large-scale projects under construction remained unchanged. The largest development is Kilroy Oyster Point’s Phase II, that will include 865,000 square feet of life science space.
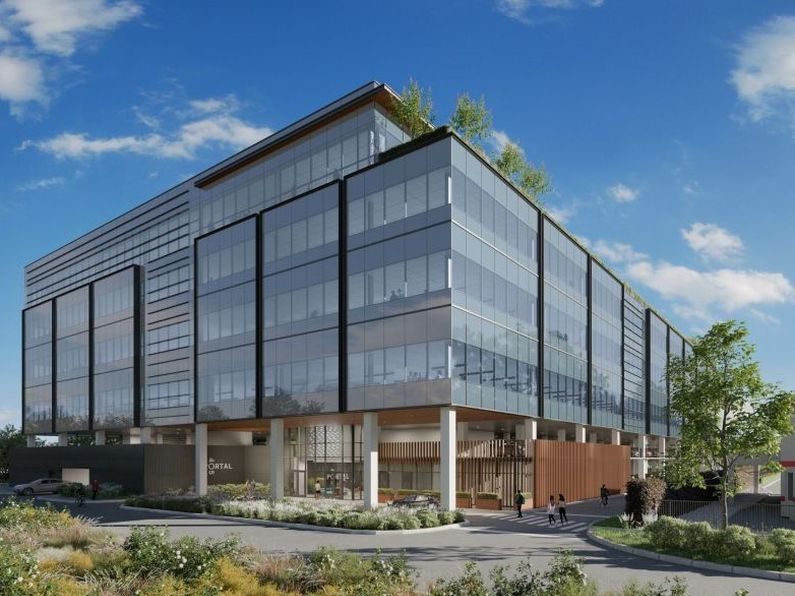
Since the beginning of the year, developers broke ground on a single significant office project in San Francisco, slated to include 91,000 square feet. Similarly, one property reached completion in the metro, encompassing 240,000 square feet and marking a 74.7 percent decline in deliveries on a year-over-year basis. The property is Menlo Equities’ Portal 405, a life science Class A building at 405 Industrial Road in San Carlos, Calif. The company worked in partnership with Beacon Capital Partners to develop the project that broke ground in 2023.
Potential for residential makeovers in San Francisco
With most markets posting high vacancies, office-to-residential conversions gained ground as an attractive option for property owners. San Francisco adopted the Downtown Adaptive Reuse Program in July 2023, allowing owners with underutilized office buildings in the city’s downtown area to convert them more easily into housing. The program includes an initiative with adjustments to the City’s Planning code, allowing exemptions from certain housing requirements for downtown properties.
In March 2024, the city approved Measure C, a one-time transfer tax waiver for the applicable upon the first sale of properties that receive Planning Department approvals for office-to-residential conversion before 2030.
To help assess markets with strong repositioning potential, CommercialEdge launched the Conversion Feasibility Index, a tool that evaluates a building’s suitability for residential conversion through property-level scores categorized into three tiers.
San Francisco had 215 properties 17.3 totaling million square feet in the Tier I category and 373 properties in the Tier II category, comprising 47.6 million square feet.
Discount deals trend still hits, prices remain high
Year-to-date through February, the metro’s office sale volume added up to $183 million, with eight properties totaling 750,004 square feet changing ownership. This represents a 145.1 percent growth in transaction volume year-over-year, while assets traded at an average sale price of $282 per square foot—significantly above the national average of $177 per square foot.
San Francisco’s office investment volume placed it fifth among gateway markets, surpassing Boston ($147 million), Miami ($55 million) and Seattle ($39 million). Manhattan led the ranking with $1.8 billion in sales, followed by Chicago ($561 million) and Washington, D.C. ($330 million).
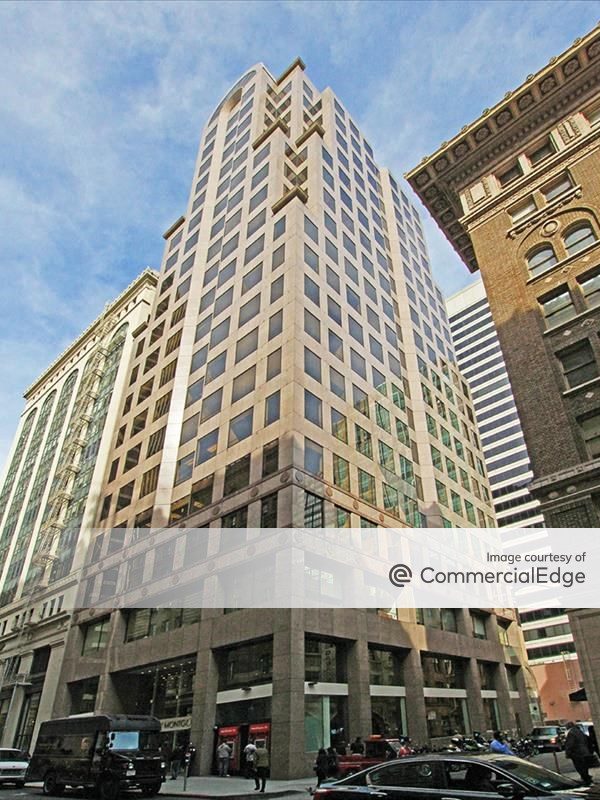
One of the largest deals since the start of the year was the $76.3 million sale of 33 New Montgomery St., a 240,134-square-foot building in the city’s South Financial District. Ridge Capital Investors purchased the property from Barrings in January, at about $317.6 per square foot.
The second-largest deal was Hearst’s $43 million purchase of 450 Sansome St., a 140,000-square-foot mid-rise in the metro’s North Financial District. Zurich-based Swiss RE sold the 1967-built property at a 51.7 percent lower dollar amount when compared to its former sale price.
San Francisco maintains its position as one of the most expensive markets on our list. Its $282 per square foot average placed the metro as the runner-up among gateway cities, surpassing Miami ($239 per square foot), Los Angeles ($207 per square foot) and Boston ($188 per square foot). Manhattan regained its spot as the leader in sales prices, with its $450 per square foot average.
The coworking sector’s progress
San Francisco flex office market comprised 3.4 million square feet across 126 locations as of February. The metro’s coworking supply has expanded, when compared to the 2.1 million square feet recorded at the start of 2024.
San Francisco’s share of flex space as percentage of total leasable office space stood at 2 percent—on par with the national figure. Miami led this with a 3.7 percent share, while Chicago and Manhattan followed, with 2.4 percent and 2.3 percent, respectively.
The coworking company with the largest footprint in San Francisco remains WeWork, with locations totaling 736,795 square feet. Flex office providers that followed include Regus (337,544 square feet), Studio by Tishman Speyer (256,759 square feet), Industrious (160,553 square feet) and Spaces (154,847 square feet).


You must be logged in to post a comment.