Stellar September Showing Lifts US Hotels to New Heights
Figures for occupancy rate, average daily rate and revenue per available room over the first nine months of the year illustrate the resiliency and strength of broad economic trends driving travel and hotel performance, according to hotel data firm STR.
By Art Gering
Guests crowded into U.S. hotels in September, generating all-time highs in occupancy rate, average daily rate (ADR) and revenue per available room (RevPAR) for the month and the period covering the first three quarters of 2017. That finding comes from Hendersonville, Tenn.-based STR, a hotel data firm. Figures for occupancy rate, ADR and RevPAR over the first nine months of the year illustrate the resiliency and strength of broad economic trends driving travel and hotel performance. These trends include steady job creation, rising consumer spending and expansionary readings in the Institute for Supply Management’s monthly indexes of manufacturing and service-sector activity.
Industry disruptors
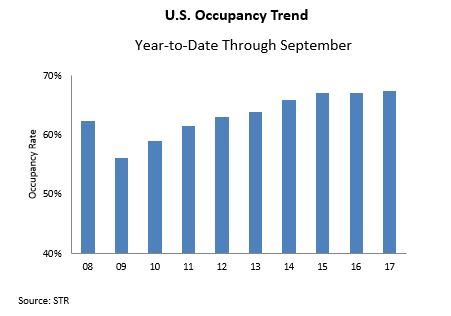
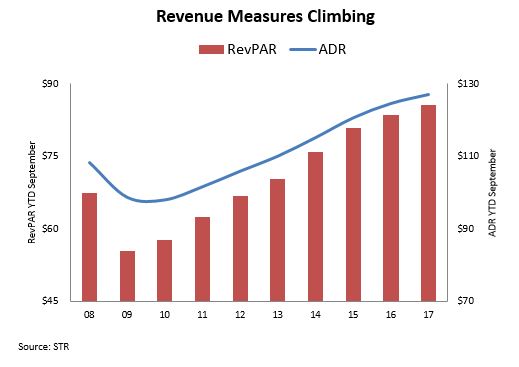
Year-to-date occupancy of 67.4 percent through September represents a 40-basis point bump from the corresponding period one year ago, according to STR. ADR (room revenue divided by occupied rooms) and RevPAR (measures the relationship between hotel revenues and room supply) increased 2.0 percent and 2.6 percent, respectively, over the same stretch.
The monthly results in September extend an industry upswing that started in early 2010 and encompasses 91 consecutive months of RevPAR growth, according to Jan Freitag, STR’s senior vice president of lodging insights. That current streak is one of the longest on record. Occupancy of 69.7 percent in the month of September marked a hefty gain of 100 basis points from one year ago and was driven by one-off events. Major hurricanes filled hotels in Florida and Texas with displaced residents, media and relief workers, Freitag explained, more than offsetting a decline in travel related to the shift of Jewish holidays to September this year.
The two natural disasters lifted the number of occupied rooms in September to a record 108 million. All of the increase can be attributed to the events in Florida and Houston, Freitag said, and the states also had a disproportionate impact on nationwide statistics. “If you look at [national] RevPAR growth of 2.6 percent in September, if Florida and Texas are taken out, total U.S. RevPAR growth is only 0.7 percent,” he reported.
Large markets
The performance of large markets in Florida and Texas also stood out in September, Freitag pointed out. Monthly RevPAR in Orlando soared nearly 25 percent, while September occupancy climbed more than 800 basis points to 76.3 percent. Houston’s occupancy rate jumped from less than 60 percent in September last year to more than 85 percent in 2017. A 60.5 percent rise in RevPAR also lifted the year-to-date to 1.8 percent, erasing a decline in RevPAR over the preceding eight months related to a supply increase and corresponding drop in the occupancy rate.
More than 3,000 rooms came online in Houston during the past year, and the roughly 4,500 rooms under construction represent one of the largest pipelines in the country, according to STR. While the delivery of those projects may be delayed by rebuilding of other structures damaged by the hurricane, some 190,000 rooms remain under way nationwide, a figure approximating the peak of the current cycle.
Nearly half of the rooms currently coming out of the ground sit in the nation’s 25 largest markets by room count, a group that comprises about 35 percent of all rooms nationwide, Freitag explained. “If you’re in a large metro and look out the back window of your hotel, chances are there’s a crane and someone is going to be a competitor to you,” he added. Supply growth is proportionately lower in all other markets, a diverse array of sizable metros that includes San Antonio, the major Ohio metros, and the Inland Empire.
Without competition from new supply, markets outside of the 25 largest continue to post higher rates of growth in key performance measures, highlighted by a RevPAR gain of 3.4 percent year to date. That’s more than two times the increase in the largest markets.
For an industry accustomed to overbuilding-induced downturns, the size of the current pipeline is a subject of interest, if not some concern should the economy suffer a sudden shock that disrupts travel. Supply growth led STR’s Freitag to forecast flat U.S. occupancy this year in the mid-65 percent range, still an all-time high, followed by modest declines in 2018 and 2019. Given the projected neutral or negative contributions from occupancy, “we expect RevPAR going forward to be driven by ADR growth,” he said. RevPAR growth is commonly estimated as the sum of the percentage change in occupancy and the percentage change in ADR. Generally, RevPAR driven solely by occupancy incurs greater labor expenses for hotel operators, whereas simply raising the daily rate on a website has negligible associated costs.
Little appears to stand in the way of the hotel industry’s continued growth. However, potential obstacles include protectionist trade measures that could harm U.S. manufacturers and curtail travel. Manufacturing represents a small portion of the U.S. economy but is a potent source of room demand for hotels that count on plant and facility visits by vendors’ representatives to fill beds during the workweek. More stringent immigration policies could also potentially constrict a key flow of hotel labor.
Art Gering is a freelance writer based in Phoenix. Most recently he was the longtime senior hospitality sector analyst for Marcus & Millichap Real Estate Investment Brokerage.





You must be logged in to post a comment.