Suburbs Dominate Coworking Space Expansion
The latest CommercialEdge report reveals a significant shift in the geography of flex office spaces.
Suburban areas are experiencing a boom. Over the last year, CommercialEdge observed a rise in flex space, reaching 124.8 million square feet from 113.5 million.

Suburban markets accounted for nearly all of this expansion, with a notable increase of almost 9 million square feet of coworking space, compared to a marginal 400,000 square feet in urban regions. As a result, the suburban share of national flex space has jumped to 47 percent, nearly equal to its urban counterpart, which amounts to 48 percent.
This trend is particularly pronounced outside of major urban hubs like Manhattan. The report suggests this shift is driven by companies embracing remote and hybrid models, seeking flexible workspace solutions for collaboration and focused work closer to employees’ homes. While this suburban dominance remains uncertain, there’s still something to be said about the enduring appeal of amenities and transportation offered by vibrant city centers.
READ ALSO: Coworking Trends to Keep an Eye On in 2024
In March, office-using sectors saw a net gain of 10,000 jobs. Professional and business services added 7,000 jobs, while financial activities added 3,000. Meanwhile, the information sector remained stagnant compared to February. Year-over-year, office employment has increased by 0.6 percent, but the slowdown poses challenges for recovery from remote and hybrid work shifts.
Some 87.9 million square feet of new office space was underway nationwide at the end of March, accounting for 1.3 percent of total stock, CommercialEdge shows. The office construction pipeline has decreased by almost 40 percent in the last two years, a trend likely to continue due to declining demand, rising capital costs and stricter construction loan standards. Office starts averaged 64 million square feet annually from 2020-2022, dropping to 44.1 million square feet in 2023, and only 2.8 million square feet in Q1 2024.
As of March, Boston had 13.9 million square feet of office space underway, accounting for 5.6 percent of existing stock. San Francisco had 5.3 million square feet under construction (3.3 percent of stock), followed closely by Dallas (5.1 million square feet, 1.8 percent of stock). Austin had 4.3 million square feet underway, or 4.6 percent of stock. Total office investment in the first three months of 2024 totaled $5.4 billion, while the average sale price for a property stood at $171 per square foot.
Tech hubs lead nationwide vacancy surge
The national office vacancy rate continued to rise, reaching 18.2 percent at the end of March, a 120-basis-point increase from the same period last year. In recent years, vacancy rates have risen due to widespread adoption of remote and hybrid work models and reassessment of office needs.
This trend isn’t limited to any specific market or sector, with notable increases seen in tech hubs such as San Francisco (510 basis points year-over-year), Seattle (390 basis points), San Diego (380 basis points), the Bay Area (350 basis points) and Denver (330 basis points).
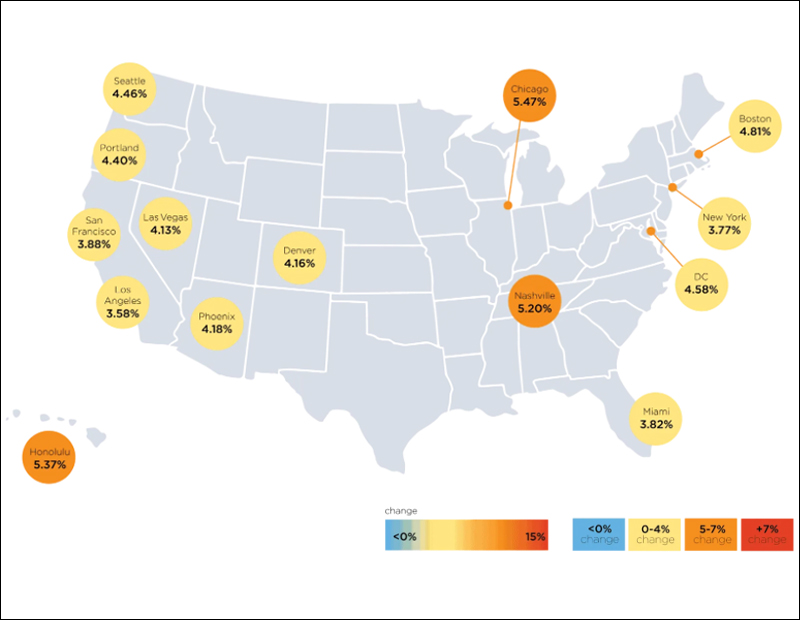
National full-service equivalent listing rates averaged $37.74 per square foot in March, a 130-basis-point decrease from the previous year and 9 cents less than the prior month. Notably, New Jersey (5.0 percent), Austin (4.5 percent), Miami (3.8 percent) and Atlanta (3.0 percent) saw significant year-over-year increases in average in-place rents.
Read the full CommercialEdge office report.


You must be logged in to post a comment.