Top 5 Markets for Office Transactions
Investment sales in these markets accounted for 36 percent of the nation’s total, according to CommercialEdge data.
Some $19 billion worth of office assets across 68 million square feet changed hands year-to-date through April, according to CommercialEdge data. Dollar volume recorded a 66 percent dip from the same period in 2020 when transaction volume exceeded $26 billion. So far this year, investors mostly focused their attention on fully leased assets and tech-centered campuses in gateway markets, as well as local landmarks.
The metros below represent the top-performing markets for office transactions, based on CommercialEdge data. Transaction volume in each of these surpassed the billion-dollar mark, with the total amounting to more than $8 billion. This translates into 36 percent of the nation’s total sales volume.
| Rank | Market Name | Transaction Volume ($MM) | Total Properties Sold |
| 1 | Bay Area | $2,938.88 | 40 |
| 2 | San Francisco | $1,522.62 | 11 |
| 3 | Seattle | $1,300.56 | 44 |
| 4 | Dallas-Fort Worth | $1,269.63 | 28 |
| 5 | Manhattan | $1,026.18 | 5 |
Source: CommercialEdge
5. Manhattan
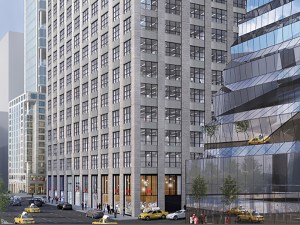
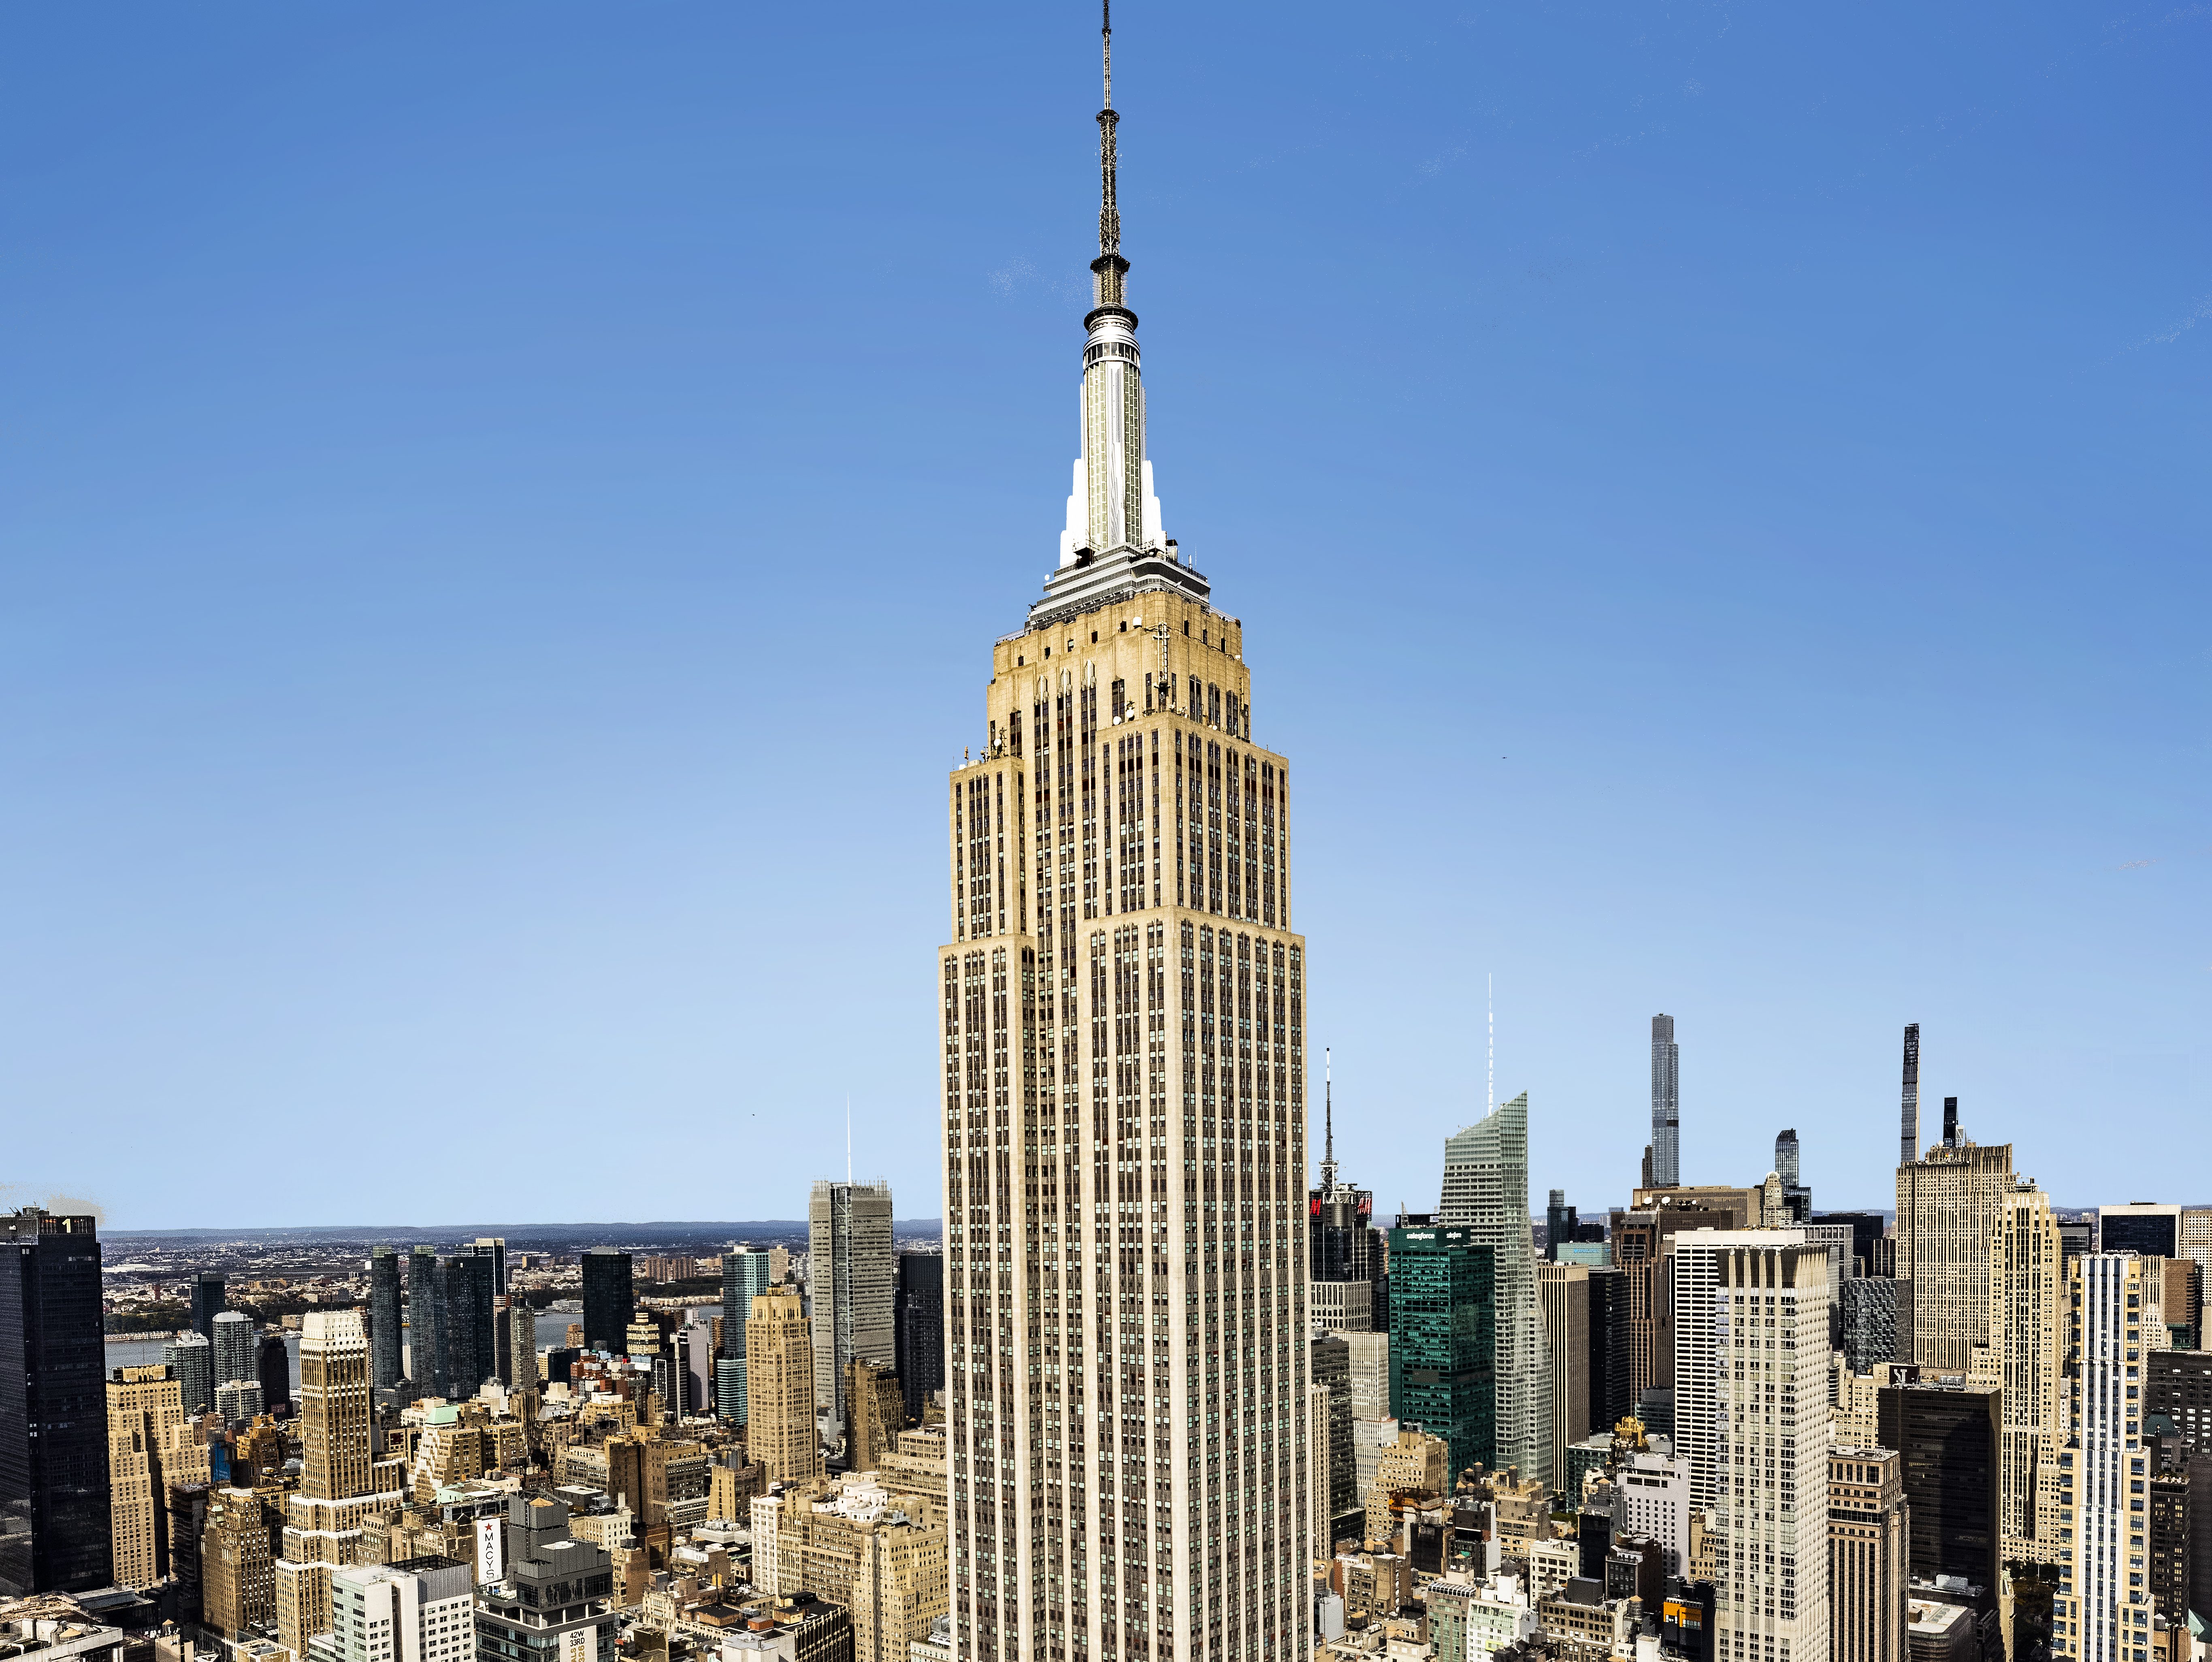
Transaction volume as of April totaled more than $1 billion in Manhattan, encompassing five properties trading at an average of $1,220 per square foot—the highest price among the markets on the list. In the borough’s largest transaction this year so far, The 601W Cos. acquired 410 10th Avenue for $809.9 million from an SL Green Realty Corp. joint venture.
The 638,000-square-foot Chelsea high-rise changed hands at $1,336 per square foot, with JPMorgan Chase providing $809.9 million in acquisition financing. Amazon anchors the building and occupies more than 350,000 square feet. The deal represents institutional investors’ ongoing interest in well-located, premier assets and landmark properties leased by a roster of prestigious tenants.
4. Dallas-Fort Worth
Alongside a handful of Southern markets, Dallas-Fort Worth is poised to recover faster than other metros due to continuous in-migration, which fueled office investment in the first four months of the year. A total of 28 properties changed hands in the metro as of April for a combined $1.2 billion. The deals involved more than 7.6 million square feet, trading at an average of $270.5 per square foot.
In one of the biggest deals this year through April, Crescent Real Estate paid $700 million for The Crescent, a 1.3 million-square-foot mixed-use development in Uptown Dallas. The 2021 March transaction marks a repurchase from JP Morgan Asset Management—Crescent had sold the asset in 2004. The property underwent a $33 million renovation, spearheaded by the former owner in 2016.
3. Seattle
Deals involving big tech names led sales activity in Seattle. Some 3.9 million square feet changed hands for a total of $1.3 billion through April, at an average of $433.98 per square foot. Investors continued to focus on fully leased tech campuses and assets anchored by big names such as Amazon or Google.
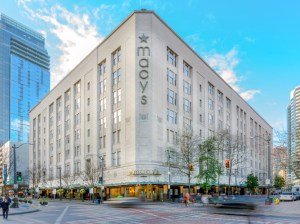
In one of the largest office deals in the metro, KKR and Seattle-based Urban Renaissance Group paid $580 million for 300 Pine, a 770,000-square-foot landmark office building in Seattle’s retail core. The former Macy’s flagship store spreads across a full block and Amazon occupies the entire office portion.
2. San Francisco
While office properties continued to change hands at record-breaking prices in San Francisco, sales activity tempered early this year—only 11 properties totaling 2 million square feet traded for a total of $1.5 billion. The average price per square foot stood at $757.94, making San Francisco the second-most expensive office market in the nation.
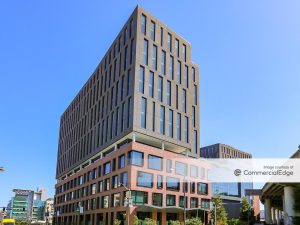
In March, Kilroy Realty Corp. agreed to sell The Exchange on 16th, a 750,000-square-foot premier property in San Francisco’s Mission Bay neighborhood. The asset traded for $1.08 billion, or about $1,440 per square foot, marking the highest price per square foot ever paid for a major commercial property in the city.
1. Bay Area
The Bay Area hasn’t lost its shine thanks to its thriving tech-centric tenancy, which continues to fuel the office sector’s growth. Investors closed 40 transactions in the market year-to-date through April for a total of $2.9 billion. More than 5 million square feet sold at an average of $623.77 per square foot.
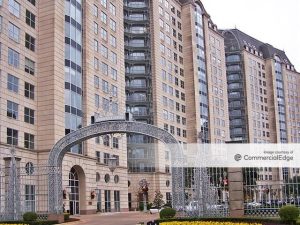
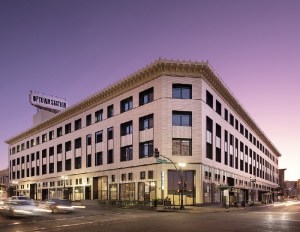
Singapore-based Mapletree Investments was the Bay Area’s top buyer in the first months of 2021 with its $419 million acquisition of Uptown Station. The company purchased the 397,000-square-foot creative office and retail building in Oakland from CIM Group in March.


You must be logged in to post a comment.