Vacancies Continue to Rise Amid Banking Turmoil – Q1 Office Analysis
Future of office debates have reverberated in recent weeks as the stability of the banking system and their commercial real estate investments have come into question.
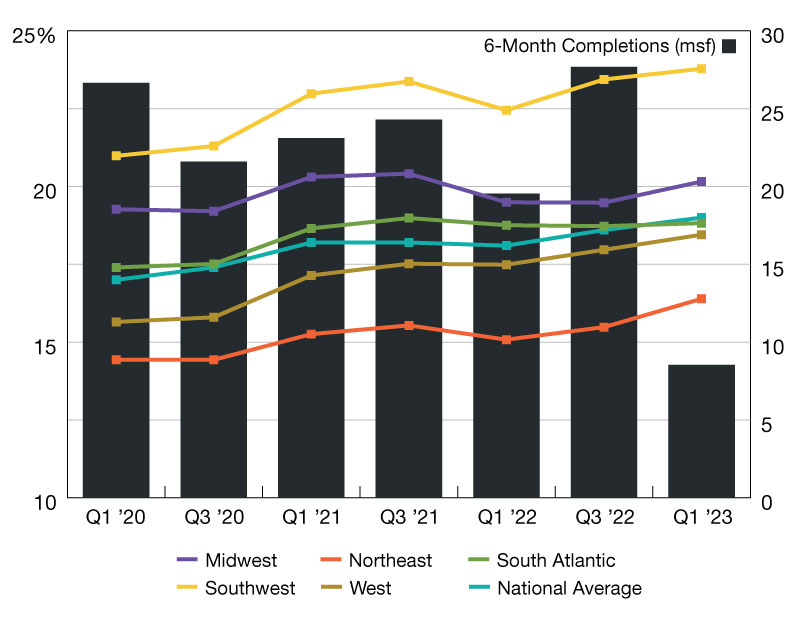
Future of office debates have reverberated in recent weeks as the stability of the banking system and their commercial real estate investments have come into question. First quarter data indicates the average office vacancy was trending up across regions as hybrid employment models prevail. The national office vacancy rate rose to 19.0 percent, above the peak vacancy observed during the early stages of the pandemic and close to its historic peak of 19.3 percent back in 1991. This represents the fourth straight quarter of office vacancy increases with few signs pointing towards a reversal in coming quarters.
Regional Vacancy Rates Q1 2020 – Q1 2023
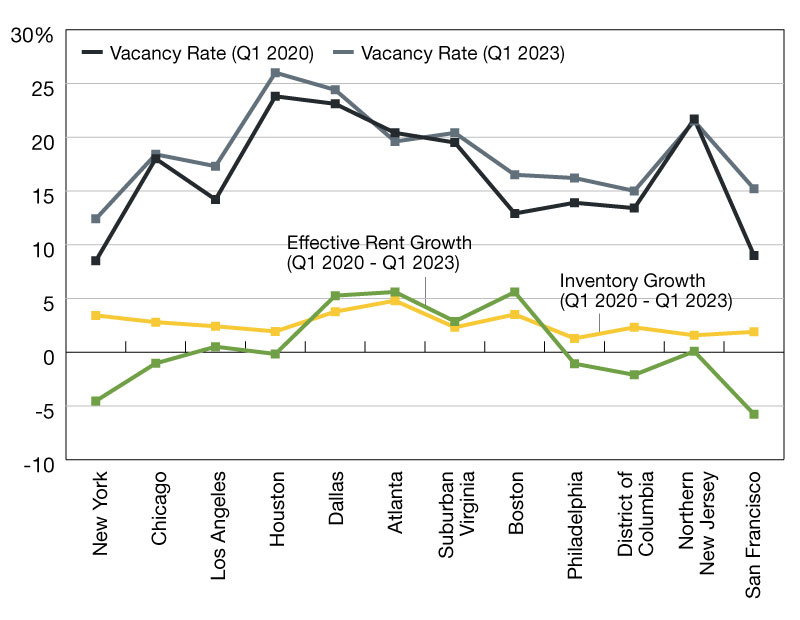
Figure 2 highlights metro performance in our 12 largest office metros, revealing shared burdens with few standouts. Expensive markets such as New York, Boston, and San Francisco have been hit particularly hard given the financial incentives of downsizing or relocation. Metros in the Sunbelt fared better but maintained higher vacancy rates for longer periods, with Atlanta being a particular standout metro in the most recent quarter.
While vacancy increases rose across the board, we see wide variation in rent price growth since the start of the pandemic in 2020. During this period, the national vacancy rate climbed from 17.0 percent to 19.0 percent. Effective rents, on the other hand, increased marginally from an average of $28.02/sq ft. to $28.13/sq ft despite significant inflationary pressures over the last year. Vacancies have risen in 92 percent (or 11 of the 12) largest office metros since Q1 2020, but effective rents are split evenly between increases and declines.




You must be logged in to post a comment.